
This 340-page trends report from BOND, the investment firm co-authored by Mary Meeker, opens with a title slide, a date and author page, and a Context page explaining how the data set grew from a few charts. It then presents an outline of seven themes: a framing section on why change feels faster than ever, followed by user, usage and capital expenditure growth, AI model compute and inference costs, usage and loss growth, monetization threats from competition and China, physical world ramps, global internet user growth, and changes to work. Before those themes, the deck offers an overview of technology and geopolitics, a long history of compounding technology and knowledge distribution, and a timeline of AI milestones from 1950 onward. It is built almost entirely from charts, each with a headline title, subtitle and source line, and uses quotes from executives and researchers as section dividers. Later sections cover enterprise, government and research adoption before closing on benefits and risks.
Slides worth studying
Questions about this deck
How many pages or slides does the Bond AI trends report have?
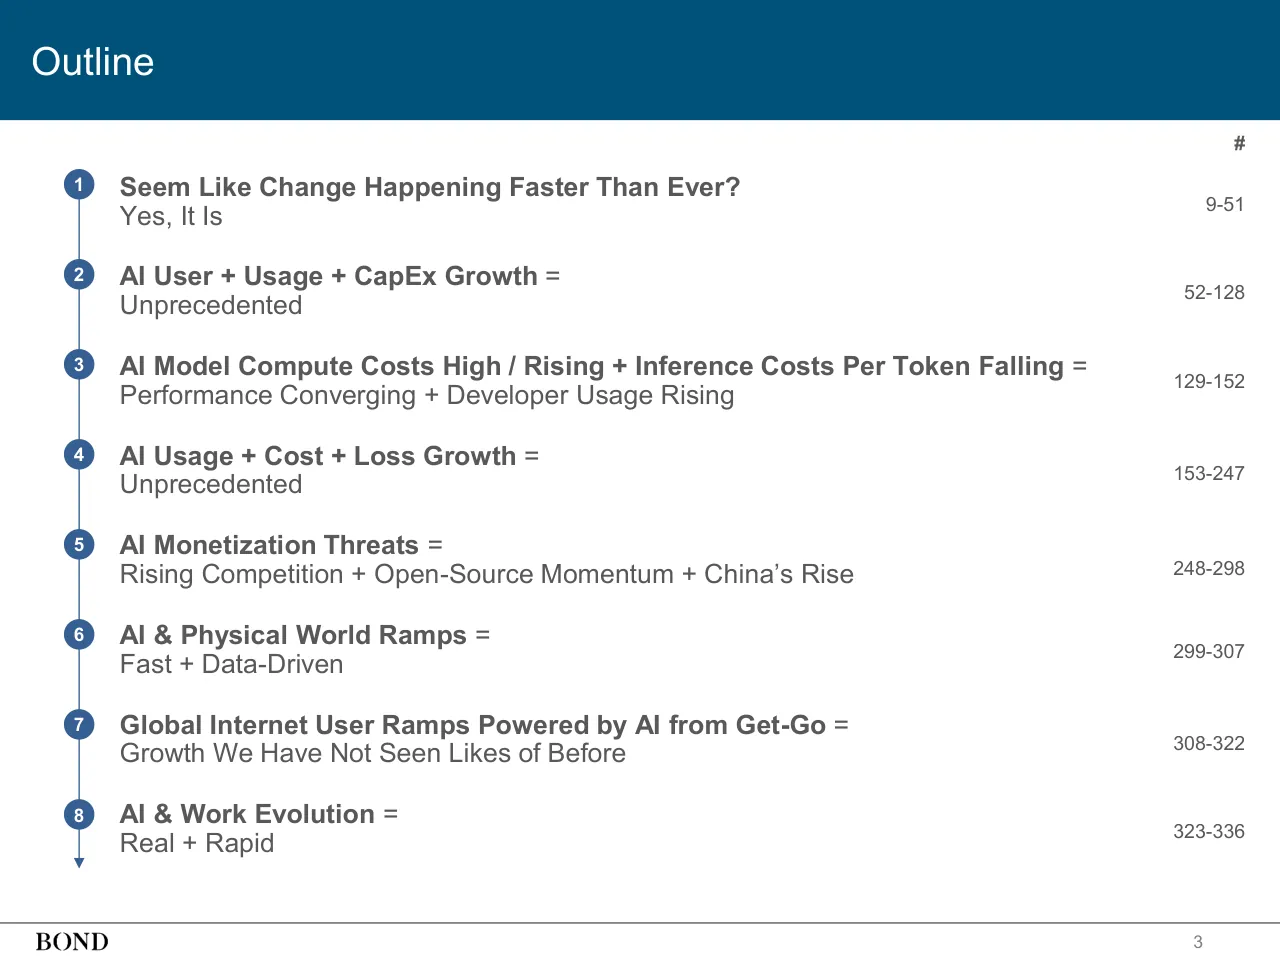
The report is listed as 340 pages long. Slide 4 shows the outline running through the final section, AI & Work Evolution = Real + Rapid, on pages 323-336.
How is the Bond Artificial Intelligence trends deck structured?
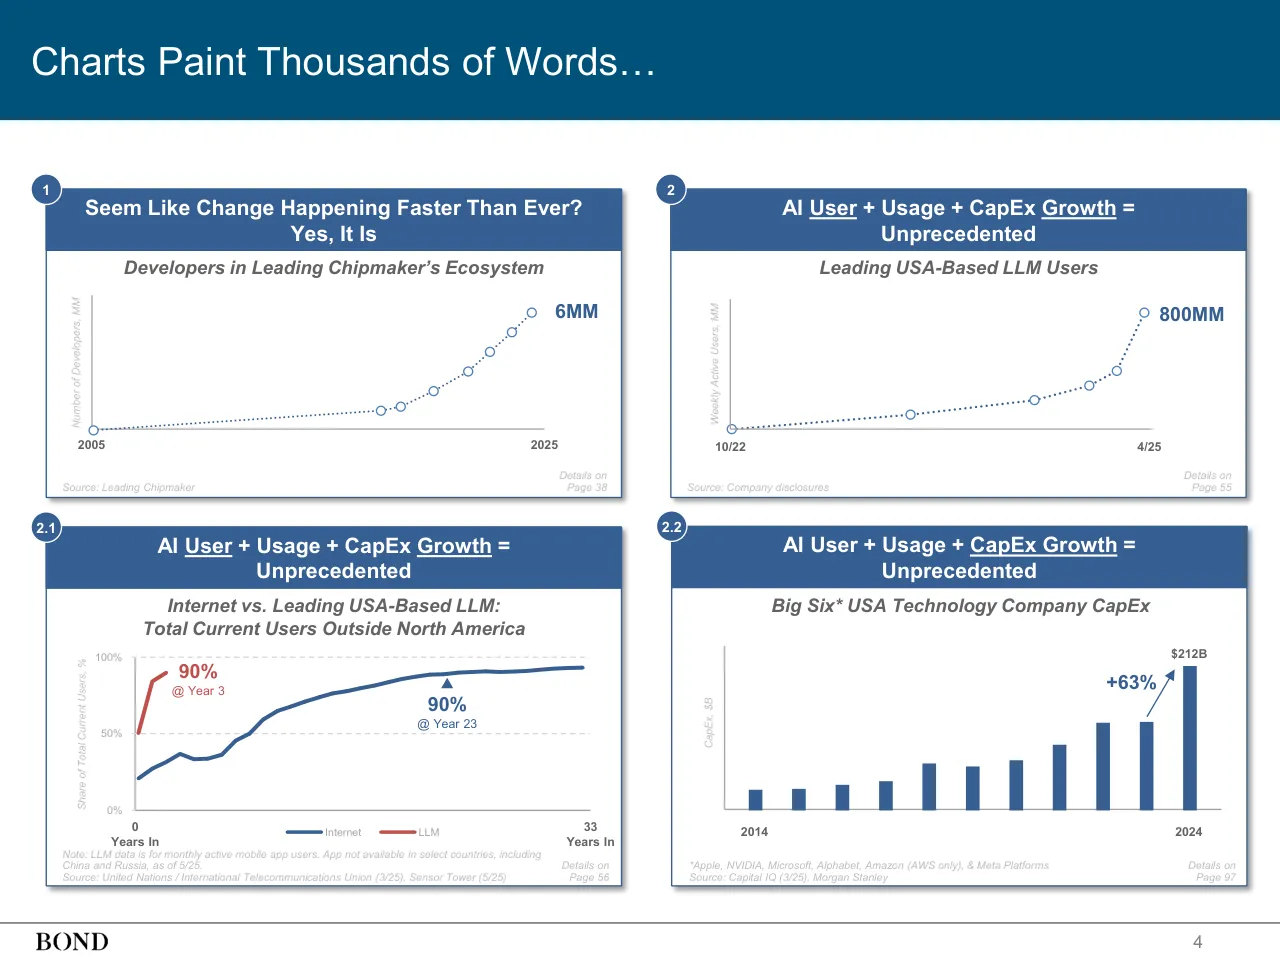
Slide 4 presents the outline in seven themes, including AI User + Usage + CapEx Growth = Unprecedented on pages 52-128 and AI Monetization Threats = Rising Competition + Open-Source Momentum + China's Rise on pages 248-298. Slide 3 says the outline is followed by eleven charts that illustrate the observations that follow.
What does the Bond AI deck say about ChatGPT's growth compared with Google?
Slide 21 is titled Time to 365B Annual Searches = ChatGPT 5.5x Faster vs. Google. It states that ChatGPT hit 365B Annual Searches in 2 Years (2024) versus Google's 11 Years (2009).
What does Bond say about AI training compute growth in its trends deck?
Slide 16 is headed 360% Annual Growth Over Fifteen Years of Compute to Train AI Models. Its chart shows Training Compute (FLOP) for Key AI Models from 1950-2025, per Epoch AI.
Details
- Company: Bond
- Year: 2025
- Type: Report-style deck
- Industry: Investment research / Venture capital
- Pages: 340
Review score: 8 out of 10, Strong
Presentation quality, judged with the SlideDeck Co review heuristic. Ask, evidence and idea merit are not rated here.
The deck has a clear, disciplined route: a Context page (3), an outline of numbered themes with page ranges (4), a one-page preview of the key charts (5-7), and a repeated outline slide that highlights the current theme (10, 53). Nearly every content slide uses the same pattern of a headline claim in the blue band, a chart title with source, a clean chart, and a footer that repeats the section name, so a reader can scan the argument from the titles alone. The weaknesses are that text-only pages (3, 8, 9) are dense and small, source notes are nearly unreadable, and there are many pure divider slides (11, 14, 23, 31, 33, 35) with an empty title band; the density also assumes a reader rather than a presenter.
Worth keeping: Keep the headline-as-claim titles, the consistent chart framing with subtitle and source line, the highlighted outline slides that show position in the argument, and the preview page of eight charts on slide 5.
Most useful repair: Enlarge or cut the small, centered text on slides 3, 8 and 9, and raise the contrast of the footnotes and axis labels on slides such as 38, 41 and 56.
What would change the score: I would fill or remove the empty blue bands on divider and quote slides (11, 14, 22, 27, 28) and tighten pages that repeat the same point, such as the 'AI =' timeline dividers (31, 33, 35).
Confidence medium. 72 of 340 pages inspected on contact sheets, 4 at readable size. Reviewed 2026-11-08. Model-assisted review (claude-sonnet-5-5).
Full text of the slides (340 slides)
Every slide's words and a description of its charts and images, so the deck can be searched and rebuilt. Also available as Markdown.
Slide 1
O
Trends –
Artificial Intelligence
BOND
May 2025
Visuals: Logo: a single serif capital letter O in light blue (#A9C4DC), centred at the top of the slide, rendered as a monogram-style mark. No photographs, charts, icons or other graphics appear on the slide.
Slide 2
Trends – Artificial Intelligence (AI)
May 30, 2025
Mary Meeker / Jay Simons / Daegwon Chae / Alexander Krey
Visuals: One logo: the BOND wordmark in dark grey serif capitals (about #4D4D4D), placed below the author line at the left margin. No charts, photographs or other graphics.
Slide 3
Context
We set out to compile foundational trends related to AI. A starting collection of several disparate datapoints turned into this beast.
As soon as we updated one chart, we often had to update another – a data game of whack-a-mole…
a pattern that shows no sign of stopping…and will grow more complex as competition
among tech incumbents, emerging attackers and sovereigns accelerates.
Vint Cerf, one of the ‘Founders of the Internet,’ said in 1999, ‘…they say a year in the Internet business is like a dog year –
equivalent to seven years in a regular person's life.’ At the time, the pace of change catalyzed by the internet was unprecedented.
Consider now that AI user and usage trending is ramping materially faster…and the machines can outpace us.
The pace and scope of change related to the artificial intelligence technology evolution is indeed unprecedented,
as supported by the data. This document is filled with user, usage and revenue charts that go up-and-to-the-right…
often supported by spending charts that also go up-and-to-the right.
Creators / bettors / consumers are taking advantage of global internet rails that are accessible to 5.5B citizens via
connected devices; ever-growing digital datasets that have been in the making for over three decades;
breakthrough large language models (LLMs) that – in effect – found freedom with the November 2022 launch of
OpenAI’s ChatGPT with its extremely easy-to-use / speedy user interface.
In addition, relatively new AI company founders have been especially aggressive about innovation / product releases / investments /
acquisitions / cash burn and capital raises. At the same time, more traditional tech companies (often with founder involvement) have
increasingly directed more of their hefty free cash flows toward AI in efforts to drive growth and fend off attackers.
And global competition – especially related to China and USA tech developments – is acute.
The outline for our document is on the next page, followed by eleven charts that help illustrate observations that follow.
We hope this compilation adds to the discussion of the breadth of change at play – technical / financial / social / physical / geopolitical.
No doubt, people (and machines) will improve on the points as we all aim to adapt to this evolving journey
as knowledge – and its distribution – get leveled up rapidly in new ways.
Special thanks to Grant Watson and Keeyan Sanjasaz and BOND colleagues who helped steer ideas and bring this report to life.
And, to the many friends and technology builders who helped, directly or via your work, and are driving technology forward.
2
Slide 4
Outline
#
Seem Like Change Happening Faster Than Ever?
Yes, It Is
9-51
AI User + Usage + CapEx Growth =
Unprecedented
52-128
AI Model Compute Costs High / Rising + Inference Costs Per Token Falling =
Performance Converging + Developer Usage Rising
129-152
AI Usage + Cost + Loss Growth =
Unprecedented
153-247
AI Monetization Threats =
Rising Competition + Open-Source Momentum + China’s Rise
248-298
AI & Physical World Ramps =
Fast + Data-Driven
299-307
Global Internet User Ramps Powered by AI from Get-Go =
Growth We Have Not Seen Likes of Before
308-322
AI & Work Evolution =
Real + Rapid
323-336
3
Visuals: Diagram: a thin vertical blue line (#3B6497, about 0.2% of slide width) runs down the left margin from the first numbered circle to a small downward-pointing solid blue triangle arrowhead at the bottom. Eight solid blue filled circles (#2F5E96, about 2.4% wide by 3.2% tall) sit centred on the line, one beside each row, numbered 1 to 8 in white bold Arial. Each circle is a step marker connected in sequence by the line, which flows downward. A small BOND wordmark logo (dark serif capitals, black on white) sits at bottom left, image 127 by 71 pixels, not cropped, not boxed. No photographs or charts.
Slide 5
Charts Paint Thousands of Words…
Seem Like Change Happening Faster Than Ever?
Yes, It Is
1
Developers in Leading Chipmaker’s Ecosystem
Number of Developers, MM
6MM
2005
2025
Details on
Page 38
Source: Leading Chipmaker
2
AI User + Usage + CapEx Growth =
Unprecedented
Leading USA-Based LLM Users
Weekly Active Users, MM
800MM
10/22
4/25
Details on
Page 55
Source: Company disclosures
2.1
AI User + Usage + CapEx Growth =
Unprecedented
Internet vs. Leading USA-Based LLM:
Total Current Users Outside North America
Share of Total Current Users, %
100%
90%
@ Year 3
50%
90%
@ Year 23
0%
0
33
Years In
Years In
Internet
LLM
Note: LLM data is for monthly active mobile app users. App not available in select countries, including
China and Russia, as of 5/25.
Details on
Page 56
Source: United Nations / International Telecommunications Union (3/25), Sensor Tower (5/25)
2.2
AI User + Usage + CapEx Growth =
Unprecedented
Big Six* USA Technology Company CapEx
CapEx, $B
+63%
$212B
2014
2024
*Apple, NVIDIA, Microsoft, Alphabet, Amazon (AWS only), & Meta Platforms
Source: Capital IQ (3/25), Morgan Stanley
Details on
Page 97
4
Visuals: Four chart panels, each a rasterised panel card including its blue header bar. Panel 1 (top left): dotted line chart with open blue circle markers, titled 'Developers in Leading Chipmaker’s Ecosystem', y-axis 'Number of Developers, MM' with no tick values, x-axis labelled 2005 (start) and 2025 (end); the series rises slowly then steeply, with the endpoint labelled 6MM; the grey axes are thin and unlabelled between endpoints. Panel 2 (top right): dotted line chart with open blue circle markers, titled 'Leading USA-Based LLM Users', y-axis 'Weekly Active Users, MM' with no tick values, x-axis labelled 10/22 (start) and 4/25 (end); the curve is nearly flat then turns sharply upward, with the endpoint labelled 800MM. Panel 2.1 (bottom left): line chart titled 'Internet vs. Leading USA-Based LLM: Total Current Users Outside North America', y-axis 'Share of Total Current Users, %' from 0% to 100% with dashed light-grey gridlines at 50% and 100%; x-axis 'Years In' from 0 to 33. Series Internet (dark blue line) starts about 22% at year 0, rises to about 50% near year 12, about 65% near year 16, and reaches about 90% at year 23, marked with a dark-blue triangle and label '90% @ Year 23', ending about 91% at year 33. Series LLM (red line) starts about 50% at year 0 and rises steeply to about 85% at year 2 and about 90% at year 3, labelled '90% @ Year 3' in red. Legend at bottom: blue line 'Internet' and red line 'LLM'. Panel 2.2 (bottom right): vertical bar chart titled 'Big Six* USA Technology Company CapEx', y-axis 'CapEx, $B' with no tick values, x-axis labelled 2014 and 2024 at the ends, 11 dark-blue bars for 2014 to 2024 with no value labels except the last; bars are about 14, 15, 17, 20, 32, 30, 34, 45, 60, 61 and 100 percent of the 2024 bar height (about, estimated). The 2024 bar is labelled $212B above it; a dark-blue arrow rises from the 2023 bar top to the 2024 bar, labelled +63%. Pictogram-free; no photographs, icons or logos besides the BOND wordmark.
Slide 6
…Charts Paint Thousands of Words… / AI Model Compute Costs High / Rising + / Inference Costs Per Token Falling = / Performance Converging + Developer Usage Rising / Cost of Key Technologies Relative to Launch Year / Electric Power / Computer Memory / AI Inference / % of Original Price By Year / (Indexed to Year 0) / 0 Years / 72 Years / Note: Per-token inference costs shown. / Details on / Page 138 / Source: Richard Hirsh; John McCallum; OpenAI / 3 / AI Usage + Cost + Loss Growth = / Unprecedented / Leading USA-Based AI LLM Revenue vs. Compute Expense / Revenue (Blue) & / Compute Expense (Red) / +$3.7B / -$5B / 2022 / 2023 / 2024 / Note: Figures are estimates. / Details on / Page 173 / Source: The Information, public estimates / 4 / 5 / AI Monetization Threats = / Rising Competition + / Open-Source Momentum + China’s Rise / Leading USA LLMs vs. China LLM / Desktop User Share / 75% / 60% / 21% / 10% / 15% / 0% / 2/24 / 2/25 / 4/25 / USA – LLM #1 / China / USA – LLM #2 / Desktop User Share, % / Note: Data is non-deduped. Share is relative, measured across six leading global LLMs. / Details on / Page 293 / Source: YipitData (5/25) / 5.1 / AI Monetization Threats = / Rising Competition + / Open-Source Momentum + China’s Rise / China vs. USA vs. Rest of World Industrial Robots Installed / Industrial Robots Installed / China / Rest of World / (excl. China & USA) / USA / 2014 / 2023 / Note: Data as of 2023. / Details on / Page 289 / Source: International Federation of Robotics / 5
Visuals: Four charts. (1) Panel 3, line/scatter chart titled 'Cost of Key Technologies Relative to Launch Year'. Y axis labelled '% of Original Price By Year (Indexed to Year 0)' in light grey rotated text, no printed numeric scale. X axis runs from '0 Years' to '72 Years', no numeric ticks. Three dashed series: Electric Power, blue diamond markers (#366092) connected by dashed blue line, about 17 markers falling from about 100 at year 0 to near 0 at 72 years, the largest decline in the first 20 years; Computer Memory, green triangle markers (#77933C) with dashed green line, falling steeply within about the first 10 years and then flat near zero; AI Inference, red circle markers (#C0504D) with dashed red line, falling to near zero within about 2 to 3 points at the start. Legend at upper right of plot: blue diamond 'Electric Power', green triangle 'Computer Memory', red circle 'AI Inference'. No values printed. (2) Panel 4, line chart titled 'Leading USA-Based AI LLM Revenue vs. Compute Expense'. Blue thick dashed line with open circle endpoints from 2022 (x 56.4, at about the baseline) to 2024, labelled '+$3.7B' in blue; red thick solid line with open circle endpoints from 2023 to 2024, labelled '-$5B' in red. Thin grey horizontal baseline and vertical axis line; y axis labelled 'Revenue (Blue) & Compute Expense (Red)'. No numeric scale. X labels 2022, 2023, 2024. Note says figures are estimates. (3) Panel 5, clustered column chart 'Leading USA LLMs vs. China LLM Desktop User Share'. Three categories on the x axis: 'USA – LLM #1', 'China', 'USA – LLM #2'. Each has three bars in legend order 2/24 (dark navy #366092), 2/25 (mid blue #558ED5), 4/25 (light blue #B9CDE5). USA – LLM #1: 2/24 = 75%, 2/25 about 60%, 4/25 = 60%. China: 2/24 = 0%, 2/25 about 14%, 4/25 = 10%. USA – LLM #2: 2/24 = 21%, 2/25 about 12%, 4/25 = 15%. Values are labelled in blue bold above bars; y axis labelled 'Desktop User Share, %' with no numeric scale. Legend squares with labels 2/24, 2/25, 4/25 in grey at mid-chart. Three hand-drawn arrows: red arrow across USA – LLM #1 bars pointing down-right, green arrow over China pointing up-right, red arrow over USA – LLM #2 pointing down-right. (4) Panel 5.1, multi-line chart 'China vs. USA vs. Rest of World Industrial Robots Installed' from 2014 to 2023, y axis 'Industrial Robots Installed' with no numeric scale. Series: China (red #C0504D, thick solid line) starts about mid-low in 2014, rises to a peak near 2022 and ends at the top right; Rest of World (green #77933C, thick line, label '(excl. China & USA)') starts highest in 2014, peaks near 2018, dips around 2020 and rises gently to about the same level as China at 2023; USA (blue #366092, thick line) starts lowest and stays nearly flat around the bottom. Series labelled at right end of lines. No values or gridlines printed.
Slide 7
…Charts Paint Thousands of Words / 6 / AI & Physical World Ramps = / Fast + Data-Driven / A Ride Share vs. Autonomous Taxi Provider, / San Francisco Operating Zone Market Share / 34% / 27% / 19% / 0% / 8/23 / 4/25 / Ride Share / Autonomous Taxi / Source: YipitData (4/25) / Details on / Page 302 / 7 / Global Internet User Ramps Powered by AI from Get-Go = / Growth We Have Not Seen Likes of Before / Leading USA-Based LLM App Users by Region / Mobile App / Monthly Active Users, MM / Sub-Saharan Africa / South Asia / North America / Middle East & North Africa / Latin America & Caribbean / Europe & Central Asia / East Asia & Pacific / 5/23 / 4/25 / Note: Region definitions per World Bank definitions. China not included in East Asia figures. / Data for standalone app only. Source: Sensor Tower (5/25) / Details on / Page 315 / 8 / AI & Work Evolution = / Real + Rapid / USA IT Jobs – AI vs. Non-AI / Change in USA IT Job Postings, / Indexed to 1/18 / (AI = Blue, Non-AI = Green) / +448% / -9% / 1/18 / 4/25 / Non-AI IT Jobs / AI IT Jobs / Source: University of Maryland’s UMD-LinkUp AIMaps / (in collaboration with Outrigger Group) (5/25) / Details on / Page 332
Visuals: Three line and area charts, all drawn as embedded raster images inside bordered panels. Chart 1 (top left): line chart titled A Ride Share vs. Autonomous Taxi Provider, San Francisco Operating Zone Market Share; y-axis labelled % of San Francisco Gross Bookings with no numeric tick labels; x-axis runs 8/23 to 4/25 with no tick values. Series Ride Share (green #9BBB59) starts at 34% and ends at 19%, dipping to about 25% around 12/24 and rising to about 29% near 3/25 before falling. Series Autonomous Taxi (blue #366092) starts at 0% and ends at 27%, rising steadily with a crossover with Ride Share around 1/25; the endpoint values are printed, intermediate values are about. Legend at bottom: Ride Share (green line), Autonomous Taxi (blue line). Chart 2 (top right): stacked area chart titled Leading USA-Based LLM App Users by Region; y-axis Mobile App Monthly Active Users, MM with no tick values, range 0 to about the top of the stack; x-axis 5/23 to 4/25. Stacked from bottom: East Asia & Pacific (blue #366092), Europe & Central Asia (red #C0504D), Latin America & Caribbean (green #9BBB59), Middle East & North Africa (purple #8064A2), North America (teal #4BACC6), South Asia (orange #F79646), Sub-Saharan Africa (blue #4F81BD); the stack rises from near zero in 5/23 to its maximum at the right edge in 4/25, with no printed values. Labels sit at the right of the chart, aligned to their bands. Chart 3 (bottom): line chart titled USA IT Jobs – AI vs. Non-AI; y-axis Change in USA IT Job Postings, Indexed to 1/18 (AI = Blue, Non-AI = Green) with no tick values; a grey horizontal baseline marks the 1/18 index level; x-axis 1/18 to 4/25. AI IT Jobs (blue #366092) starts near the baseline, peaks at about 2024 mid-year near the top of the plot, falls to a trough below baseline, then rises to end at +448% at 4/25. Non-AI IT Jobs (green #9BBB59) stays near the baseline, peaks modestly, then ends at -9% at 4/25. Legend at bottom: Non-AI IT Jobs (green line), AI IT Jobs (blue line). No highlighted points other than the printed endpoint labels.
Slide 8
Overview…
To say the world is changing at unprecedented rates is an understatement.
Rapid and transformative technology innovation / adoption represent key underpinnings of these changes.
As does leadership evolution for the global powers.
Google’s founding mission (1998) was to ‘organize the world’s information and make it universally accessible and useful.’
Alibaba’s founding mission (1999) was to ‘make it easy to do business anywhere.’
Facebook’s founding mission (2004) was ‘to give people the power to share and make the world more open and connected.’
Fast forward to today with the world’s organized, connected and accessible information being supercharged by
artificial intelligence, accelerating computing power, and semi-borderless capital…all driving massive change.
Sport provides a good analogy for AI’s constant improvements. As athletes continue to wow us and break records,
their talent is increasingly enhanced by better data / inputs / training.
The same is true for businesses, where computers are ingesting massive datasets to get smarter and more competitive.
Breakthroughs in large models, cost-per-token declines, open-source proliferation and chip performance improvements
are making new tech advances increasingly more powerful, accessible, and economically viable.
OpenAI’s ChatGPT – based on user / usage / monetization metrics – is history’s biggest ‘overnight’ success
(nine years post-founding). AI usage is surging among consumers, developers, enterprises and governments.
And unlike the Internet 1.0 revolution – where technology started in the USA and steadily diffused globally –
ChatGPT hit the world stage all at once, growing in most global regions simultaneously.
Meanwhile, platform incumbents and emerging challengers are racing to build and deploy the next layers of AI infrastructure:
agentic interfaces, enterprise copilots, real-world autonomous systems, and sovereign models.
Rapid advances in artificial intelligence, compute infrastructure, and global connectivity are fundamentally reshaping how
work gets done, how capital is deployed, and how leadership is defined – across both companies and countries.
At the same time, we have leadership evolution among the global powers, each of whom is challenging the other’s
competitive and comparative advantage. We see the world’s most powerful countries
revved up by varying degrees of economic / societal / territorial aspiration…
7
BOND
Slide 9
…Overview / …Increasingly, two hefty forces – technological and geopolitical – are intertwining. / Andrew Bosworth (Meta Platforms CTO), on a recent ‘Possible’ podcast described the / current state of AI as our space race and the people we’re discussing, especially China, are highly capable… / there’s very few secrets. And there’s just progress. And you want to make sure that you’re never behind. / The reality is AI leadership could beget geopolitical leadership – and not vice-versa. / This state of affairs brings tremendous uncertainty…yet it leads us back to one of our favorite quotes – / Statistically speaking, the world doesn’t end that often, from former T. Rowe Price Chairman and CEO Brian Rogers. / As investors, we always assume everything can go wrong, but the exciting part is the consideration of what can go right. / Time and time again, the case for optimism is one of the best bets one can make. / The magic of watching AI do your work for you feels like the early days of email and web search – / technologies that fundamentally changed our world. The better / faster / cheaper impacts of / AI seem just as magical, but even quicker. / No doubt, these are also dangerous and uncertain times. / But a long-term case for optimism for artificial intelligence is based on the idea that intense competition and innovation… / increasingly-accessible compute…rapidly-rising global adoption of AI-infused technology…and thoughtful and / calculated leadership can foster sufficient trepidation and respect, that in turn, could lead to Mutually Assured Deterrence. / For some, the evolution of AI will create a race to the bottom; for others, it will create a race to the top. / The speculative and frenetic forces of capitalism and creative destruction are tectonic. / It’s undeniable that it’s ‘game on,’ especially with the USA and China and the tech powerhouses charging ahead. / In this document, we share data / research / benchmarks from third parties that use methodologies they deem to be effective – / we are thankful for the hard work so many are doing to illustrate trending during this uniquely dynamic time. / Our goal is to add to the discussion. / BOND / 8
Slide 10
Outline
Seem Like Change Happening Faster Than Ever?
Yes, It Is
AI User + Usage + CapEx Growth =
Unprecedented
AI Model Compute Costs High / Rising + Inference Costs Per Token Falling =
Performance Converging + Developer Usage Rising
AI Usage + Cost + Loss Growth =
Unprecedented
AI Monetization Threats =
Rising Competition + Open-Source Momentum + China’s Rise
AI & Physical World Ramps =
Fast + Data-Driven
Global Internet User Ramps Powered by AI from Get-Go =
Growth We Have Not Seen Likes of Before
AI & Work Evolution =
Real + Rapid
9
Visuals: Vertical timeline diagram at the left: eight circles, each about 2.4% of slide width and 3.2% of slide height, stacked at x 4.95%, centred on the timeline line at x about 6.15%. Circle 1 is solid dark blue #2F5F8F with white bold number 1; circles 2 to 8 are light blue-grey #DCE6F2 fill with a thin #1F497D outline and dark blue #1F497D bold numbers 2 to 8. The connector is a 1px line in #3A6496 running from under circle 1 down to circle 8, ending in a solid downward triangle arrowhead in #2F5597 at about x 5.85%, y 89.3%, w 0.7%, h 1.2%. A semi-opaque white panel (opacity 0.82) covers the step text area from x 8.3% to 87%, y 26.3% to 90.5%, which greys out steps 2 to 8 so only step 1 reads at full strength. A BOND wordmark logo (127 by 71 px image) sits bottom-left in black serif capitals.
Slide 11
Technology Compounding =
Numbers Behind The Momentum
BOND
10
Visuals: A full-width dark blue band (#005179) across the top 12.5% of the slide, plain with no content. A thin dark grey horizontal rule across the full width near 96% of the slide height. The BOND wordmark logo at bottom left in black serif capitals. No chart, table, photograph or illustration.
Slide 12
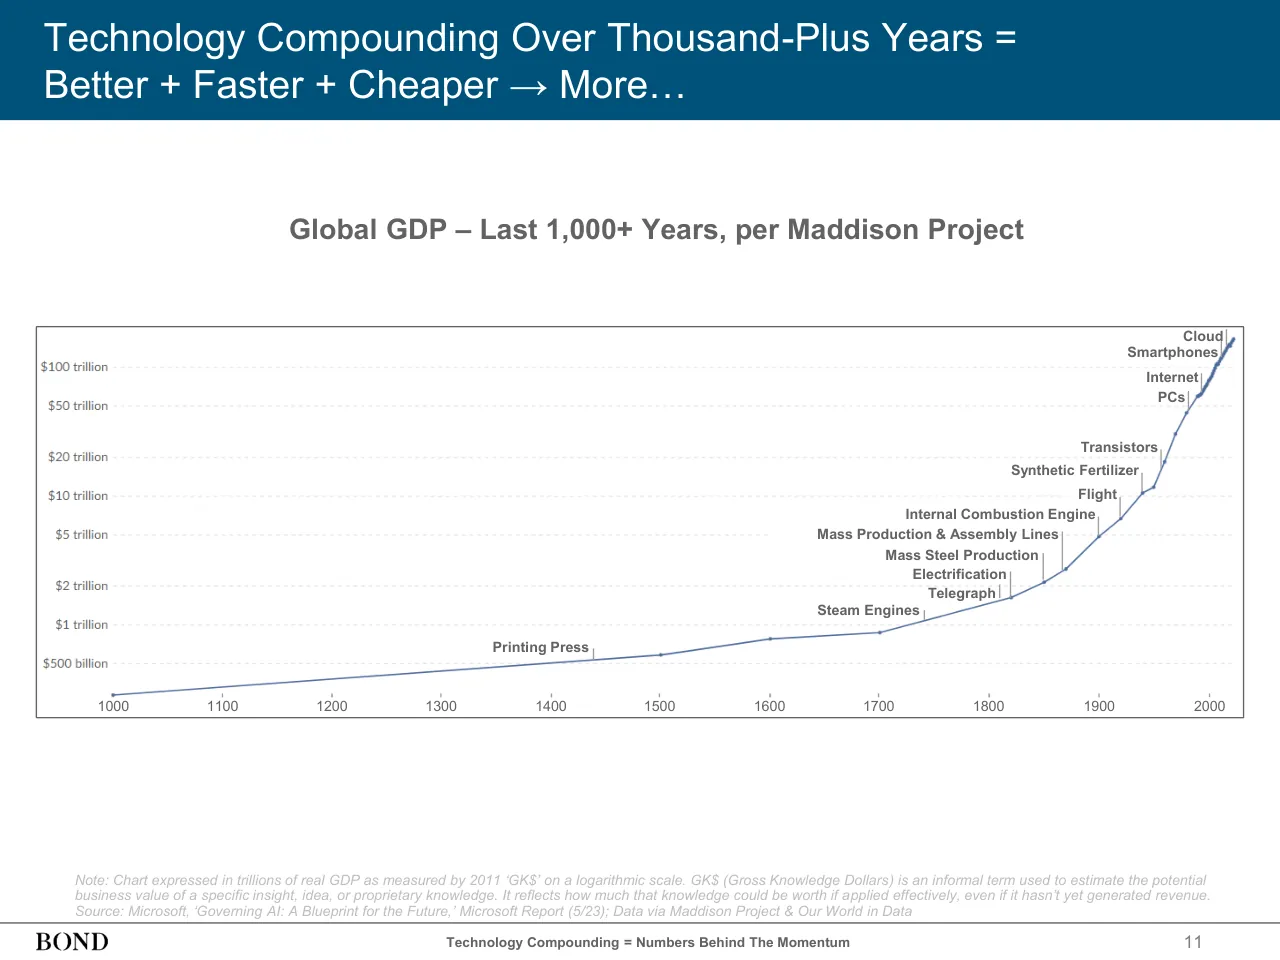
Technology Compounding Over Thousand-Plus Years = / Better + Faster + Cheaper → More… / Global GDP – Last 1,000+ Years, per Maddison Project / Cloud / Smartphones / Internet / PCs / Transistors / Synthetic Fertilizer / Flight / Internal Combustion Engine / Mass Production & Assembly Lines / Mass Steel Production / Electrification / Telegraph / Steam Engines / Printing Press / $100 trillion / $50 trillion / $20 trillion / $10 trillion / $5 trillion / $2 trillion / $1 trillion / $500 billion / 1000 / 1100 / 1200 / 1300 / 1400 / 1500 / 1600 / 1700 / 1800 / 1900 / 2000 / Note: Chart expressed in trillions of real GDP as measured by 2011 ‘GK$’ on a logarithmic scale. GK$ (Gross Knowledge Dollars) is an informal term used to estimate the potential / business value of a specific insight, idea, or proprietary knowledge. It reflects how much that knowledge could be worth if applied effectively, even if it hasn’t yet generated revenue. / Source: Microsoft, ‘Governing AI: A Blueprint for the Future,’ Microsoft Report (5/23); Data via Maddison Project & Our World in Data / BOND / Technology Compounding = Numbers Behind The Momentum / 11
Visuals: One line chart (time series) titled Global GDP – Last 1,000+ Years, per Maddison Project, with a logarithmic y-axis labelled in dollars: gridlines and tick labels at $500 billion, $1 trillion, $2 trillion, $5 trillion, $10 trillion, $20 trillion, $50 trillion and $100 trillion (top of plot about $160 trillion). The x-axis is calendar year, labelled 1000 to 2000 at 100-year intervals, with the plot running from about 950 to about 2025 and no axis titles printed. One series, a single steel-blue line (about #6B7FB5) with small dot markers at data points, with approximate values: 1000 about $0.3 trillion; 1500 about $0.6 trillion; 1600 about $0.8 trillion; 1700 about $0.9 trillion; 1820 about $1.6 trillion; 1850 about $2.5 trillion; 1870 about $4 trillion; 1900 about $5 trillion; 1920 about $7 trillion; 1940 about $10 trillion; 1960 about $20 trillion; 1980 about $50 trillion; 2000 about $80 trillion; ending about $160 trillion near 2023. Fourteen annotated points carry bold grey labels with thin grey vertical leader lines: Printing Press (about 1440), Steam Engines (about 1745), Telegraph (about 1820), Electrification (about 1815), Mass Steel Production (about 1850), Mass Production & Assembly Lines (about 1870), Internal Combustion Engine (about 1900), Flight (about 1920), Synthetic Fertilizer (about 1940), Transistors (about 1960), PCs (about 1985), Internet (about 1995), Smartphones (about 2010) and Cloud (about 2015). No point is highlighted in colour, no legend, no data labels other than the annotations. Gridlines are light grey dashed lines across the plot. The chart is a plain image of a chart, not cropped, with a white background and a thin grey (#595959) rectangular border.
Slide 13
…Technology Compounding Over Fifty-Plus Years = / Better + Faster + Cheaper → More / Computing Cycles Over Time – 1960s-2020s, per Morgan Stanley / AI Era / MM Units in Log Scale / Mobile / Internet / 1,000,000 / Desktop / Internet / Note: Axis is / logarithmic; / i.e., there are / expected to / be tens of / thousands / more AI Era / devices than / Mainframe / devices / PC / Tens of Billions / of Units / 10,000 / Minicomputer / ~4B+ / Units / 100 / Mainframe / ~1B+ / Units / Units / ~1MM+ / Units / ~300MM+ / Units / 1 / Units / ~10MM+ / CPUs / Mainframe / devices / Big Data / Cloud / GPUs / 1960 / 1970 / 1980 / 1990 / 2000 / 2010 / 2020 / 2030 / Enabling / Infrastructure / Note: PC units as of 2000. Desktop internet users as of 2005, installed base as of 2010. Mobile internet units are the installed based of smartphones & tablets in 2020. Cloud & data / center capex includes Google, Amazon, Microsoft, Meta, Alibaba, Apple, IBM, Oracle, Tencent, & Baidu for ten years ending 2022. ‘Tens of billions of units’ refers to the potential device / & user base that could end up using AI technology; this includes smartphones, IOT devices, robotics, etc. Source: Weiss et al. ‘AI Index: Mapping the $4 Trillion Enterprise Impact’ via / Morgan Stanley (10/23) / 12 / Technology Compounding = Numbers Behind The Momentum
Visuals: Bubble chart with a timeline. Chart title: Computing Cycles Over Time – 1960s-2020s, per Morgan Stanley. Y-axis: titled MM Units in Log Scale, logarithmic, labelled ticks 1 / 100 / 10,000 / 1,000,000 (the 1 and 100 and 10,000 and 1,000,000 ticks are spaced evenly on the log scale). X-axis: years 1960, 1970, 1980, 1990, 2000, 2010, 2020, 2030, range 1960 to 2030. Series, each a grey circle except AI Era: Mainframe about 1960s-1970 at roughly 1 MM, labelled ~1MM+ Units, bubble diameter about 1.8 percent of slide width; Minicomputer about 1981 at about 10 MM, labelled ~10MM+ Units; PC about 1992 at about 300 MM, labelled ~300MM+ Units (PC units as of 2000); Desktop Internet about 2003, labelled ~1B+ Units / Users; Mobile Internet about 2012, labelled ~4B+ Units; AI Era about 2023 as a navy circle #366092 labelled Tens of Billions of Units, the largest bubble, the only highlighted point. No legend. Enabling infrastructure timeline below the x-axis with a vertical grey bracket line #595959 about 1.5 px wide with round dot ends at top and bottom, at x 23.5 percent, spanning y 71.9 to 85.9 percent. Three light-blue bars with navy #366092 thin outlines, label text bold grey: CPUs bar from about 1962 to about 2016, Big Data / Cloud bar from about 1998 to 2030, GPUs bar from about 2016 to 2030. Callout box: rounded-rectangle speech bubble with a right-pointing pointer, light blue fill #DAE5F1, navy outline, soft shadow, containing Note: Axis is logarithmic; i.e., there are expected to be tens of thousands more AI Era devices than Mainframe devices. Two faint raster shadow images sit behind the callout.
Slide 14
AI Technology Compounding = / Numbers Behind The Momentum / BOND / 13
Visuals: Visual elements: one small BOND wordmark logo at bottom left (127 by 71 pixel image) showing the word BOND in black serif capitals on white. There are no charts, photographs, icons or diagrams. The only other graphic is the thin horizontal rule along the bottom and the solid header band at the top.
Slide 15
260% Annual Growth Over Fifteen Years of…
Data to Train AI Models Led To…
Training Dataset Size (Number of Words) for Key AI Models – 1950-2025, per Epoch AI
1e13
Aramco Metabrain AI
SB-LM
UL2
GNMT
1e11
KN-LM
GPT-2 (1.5B)
SNM-skip
LM
+260%
/ Year
1e9
Iterative Bootstrapping WSD
Hiero
S4
IBM-5
BPE
HLBL
1e7
GSM
LSTM
RNN-SpeedUp
SRN-Encoded Grammatical Structures
1e5
Vector Space Model
DCN+
AdaRNN
1e3
Thumbs Up?
1e1
1950
1960
1970
1980
1990
2000
2010
2020
1.3 x/year
Training Dataset Size – Number of Words
Note: Only “notable” language models shown (per Epoch AI, includes state of the art improvement on a recognized benchmark, >1K citations, historically relevant, with significant use).
Source: Epoch AI (5/25)
BOND
AI Technology Compounding = Numbers Behind The Momentum
14
Visuals: One scatter chart (embedded raster image, 952 by 736 pixels, with a thin black border) titled in the slide subtitle as Training Dataset Size (Number of Words) for Key AI Models – 1950-2025, per Epoch AI. X-axis: calendar year, labelled 1950, 1960, 1970, 1980, 1990, 2000, 2010, 2020, gridlines every ten years. Y-axis: logarithmic, number of words, labelled 1e1, 1e3, 1e5, 1e7, 1e9, 1e11, 1e13, with a rotated grey axis title Training Dataset Size – Number of Words. Teal semi-transparent dots (about #1BA3A3) mark notable language models, with labels next to selected points: Aramco Metabrain AI (about 2024, about 1e13), SB-LM (about 2007, about 3e11 to 1e12 level as printed label position), UL2 (about 2022), GNMT (about 2017, about 2e11), KN-LM (about 2007, about 5e10), GPT-2 (1.5B) (about 2019, about 2e9), SNM-skip (about 2009 to 2019 area, partly hidden), LM (partly hidden by callout, about 2023, about 1e9), S4 (partly hidden, about 2022, about 3e7), Iterative Bootstrapping WSD (about 1996, about 6e8), Hiero (about 2006, about 4e8), IBM-5 (about 1994, about 2e7), BPE (about 2014, about 1e7), HLBL (about 2009, about 1e7), GSM (about 2014, about 6e6), LSTM (about 1997, about 3e5), RNN-SpeedUp (about 2004, about 3e5), SRN-Encoded Grammatical Structures (about 1992, about 1e5), Vector Space Model (about 2012, about 1e5), DCN+ (about 2018, about 1e5), AdaRNN (about 2015, about 2e3), Thumbs Up? (about 2002, about 1.5e3). A dashed teal trend line labelled 1.3 x/year runs from about 1950 at roughly 2e1 up to about 2010 at about 2e7. A pale blue shaded band (about #E9F0FA, estimate) covers about 2010 to 2025 across the full plot height. A dark blue (#366092) arrow with a filled triangular head runs from about 2010 at 1e4 up to about 2025 at about 1e13, crossing the shaded band. A pale blue oval callout (#DAE5F1, navy outline) centred near 1.5e9 on the 2016 to 2022 area reads +260% / Year.
Slide 16
…360% Annual Growth Over Fifteen Years of…
Compute to Train AI Models Led To…
Training Compute (FLOP) for Key AI Models – 1950-2025, per Epoch AI
Grok 3
GPT-4
AlphaGo Zero
Jais
AlphaGo Lee
S4
VGG16
SB-LM
Neural LM
Hierarchical LM
TD-Gammon
Invariant CNN
LSTM LM
ISS
Swift
Handwritten Digit Recognition System
Fuzzy NN
ASE+ACE
1.5 x/year
Pandemonium (morse)
Perceptron Mark I
ADALINE
Theseus
+360% / Year
FLOP*
–
Training Compute
Publication date
1e26 1e22 1e18 1e14 1e10 1e6 1e2
1950 1960 1970 1980 1990 2000 2010 2020
*A FLOP (floating point operation) is a basic unit of computation used to measure processing power, representing a single arithmetic calculation involving decimal numbers. In AI, total FLOPs are often used to estimate the computational cost of training or running a model.
Note: Only language models shown (per Epoch AI, includes state of the art improvement on a recognized benchmark, >1K citations, historically relevant, with significant use). Source: Epoch AI (5/25)
BOND
AI Technology Compounding = Numbers Behind The Momentum
15
Visuals: Chart: scatter plot (log-scale y-axis, linear x-axis) titled 'Training Compute (FLOP) for Key AI Models – 1950-2025, per Epoch AI' in bold grey, set as a boxed image with a thin black border. Y-axis: 'Training Compute – FLOP*', logarithmic, ticks labelled 1e2, 1e6, 1e10, 1e14, 1e18, 1e22, 1e26 (about 4 orders of magnitude per tick spacing of 4). X-axis: 'Publication date' with an info icon, ticks 1950, 1960, 1970, 1980, 1990, 2000, 2010, 2020, range about 1948 to 2025. Series: one series of teal (#32B6B7-like) semi-transparent dots, each model a point with a teal label; values are about, read from the plot: Theseus about 1950 at 1e2.5; ADALINE about 1961 at 1e3; Perceptron Mark I about 1957 at 1e6; Pandemonium (morse) about 1959 at 1e8; Handwritten Digit Recognition System about 1990 at 1e11; ASE+ACE about 1980 at 1e7.5; Fuzzy NN about 1990 at 1e10; TD-Gammon about 1992 at 1e13.5; Neural LM about 2001 at 1e15; Hierarchical LM about 2005 at 1e14; Invariant CNN about 1999 at 1e12; SB-LM about 2007 at 1e18.5; LSTM LM about 2013 at 1e16; ISS about 2018 at 1e16; Swift about 2023 at 1e17; AlphaGo Lee about 2016 at 1e21; AlphaGo Zero about 2017 at 1e23; VGG16 about 2014 at 1e19; GPT-4 about 2023 at 1e25; Grok 3 about 2025 at 1e26 (top-right point). Dense clusters of unlabelled points fill 2010 to 2025 between 1e14 and 1e25. Dashed dark grey trendline labelled '1.5 x/year' runs from about 1950 at 1e5.5 up to about 2010 at 1e14. Highlighted region: a pale blue shaded band from 2010 to 2025 spanning the full plot height. Callout: an ellipse with pale grey-blue fill and dark navy outline reading '+360% / Year' in dark grey, sitting over the cluster near 2016-2018 at about 1e19. A dark blue arrow with an arrowhead runs from about 2011 at 1e14 up to about 2025 at 1e25.5, overlapping the shaded band and the callout. Legend: none. No highlighted points beyond the labelled ones. Logo: BOND wordmark in black serif capitals at bottom-left, the only other visual.
Slide 17
…200% Annual Growth Over Nine Years of…
Compute Gains from Better Algorithms Led To…
Impact of Improved Algorithms on AI Model Performance – 2014-2023, per Epoch AI
+200% / Year
Effective Compute (Relative to 2014)
Algorithmic progress
Chinchilla
OPT-175B
Compute scaling
LSTM
GPT-2
Turing-NLG
2.2 × 10^4
1.7 × 10^7
2014
2016
2018
2020
2022
Year
10^0
10^2
10^4
10^6
10^8
10^10
10^12
Note: Estimates how much progress comes from bigger models versus smarter algorithms, based on how much computing power you'd need to reach top performance without any improvements. Source: Epoch AI (3/24)
AI Technology Compounding = Numbers Behind The Momentum
16
BOND
Visuals: Chart: a stacked area chart (log scale) with a bordered raster image of 1021 by 484 pixels. Y-axis title 'Effective Compute (Relative to 2014)' with a logarithmic scale running from 10^0 at bottom to 10^12 at top, with tick labels 10^0, 10^2, 10^4, 10^6, 10^8, 10^10, 10^12 (no units printed beyond the relative label). X-axis title 'Year' with labels 2014, 2016, 2018, 2020, 2022 at evenly spaced positions; the data runs from 2014 to about 2023 (right edge). No numeric values are printed for the series except brace labels. Series 1 'Compute scaling': teal area (about #96D9D6) filling from 10^0 up to a boundary that rises from about 10^0 in 2014 through about 10^2 in 2018 to about 10^4 to 10^5 in 2019, about 10^5 at 2020, and about 10^7 in 2023. Series 2 'Algorithmic progress': light blue area (about #A5C0F0) stacked above the teal area, with its top boundary rising from 10^0 in 2014 to about 10^2 in 2016, about 10^4 in 2018, about 10^7 in 2019, about 10^8 in 2020 and about 10^12 at 2023. Legend: none; series are identified by in-chart labels 'Algorithmic progress' (upper band, about x 2021 to 2022, y 10^8 to 10^9) and 'Compute scaling' (lower band, about 2021 to 2022, near 10^3). Data points (dark teal dots, about #1F4E5F, approximately 1% diameter) with labels: LSTM at about 2015 near 10^0; GPT-2 at about 2019 near 10^4; Turing-NLG at about 2020 near 10^5; Chinchilla at about 2022.3 near 10^6.5 (about); OPT-175B at about 2022.5 near 10^6.5 (about). Braces on the right edge: an upper brace spanning the algorithmic band labelled '2.2 × 10^4' (about the ratio from the 2023 values), and a lower brace spanning the compute band labelled '1.7 × 10^7'. Highlighted: a straight dark navy arrow line from the 2014 origin at 10^0 rising to an arrowhead at the top right near 10^12 in 2023, with the oval callout '+200% / Year' sitting on the line near 2018-2019 and about 10^5 to 10^6. Gridlines: faint light teal vertical and horizontal gridlines inside the plot. Chart frame: thin black rectangle around the whole chart image.
Slide 18
…150% Annual Growth Over Six Years of…
Performance Gains from Better AI Supercomputers Led To…
Performance of Leading AI Supercomputers (FLOP/s) – 2019-2025, per Epoch AI
Enabled by 1.6x annual
growth in chips per cluster
and 1.6x annual growth in
performance per chip
Performance, 16-bit FLOP/s
10^20
10^19
10^18
10^17
10^16
xAI Colossus
El Capitan
Frontier
GPT-4 cluster
Sunway OceanLight
GPT-3 cluster
+150% /
Year
2019
2020
2021
2022
2023
2024
2025
First operational date of cluster
Leading AI supercomputers
Other AI supercomputers
Source: Epoch AI (4/25)
BOND
AI Technology Compounding = Numbers Behind The Momentum
17
Visuals: A scatter plot with a logarithmic vertical axis labelled Performance, 16-bit FLOP/s, ticks at 10^16 (bottom), 10^17, 10^18, 10^19 and 10^20 (top), range about 10^16 to about 10^20.5, and a horizontal axis labelled First operational date of cluster with year ticks 2019, 2020, 2021, 2022, 2023, 2024, 2025 at gridline intersections. Series 1, Leading AI supercomputers, are pink-magenta (#E0408F approx.) filled circles with thin darker outlines; series 2, Other AI supercomputers, are pale grey-teal (#A3BFC0 approx.) semi-transparent circles. Labelled pink points: GPT-3 cluster at about 2020.3 near 10^18.1, Sunway OceanLight at about 2021.3 near 10^18.8, GPT-4 cluster at about 2022.4 near 10^18.9, Frontier at about 2022.4 near 10^19.2, El Capitan at about 2024.8 near 10^19.5, and xAI Colossus at about 2025.1 near 10^20.3; values are estimates, none printed. A straight dark blue (#366092) trend arrow with a filled arrowhead runs from about 2019.0 near 10^17.3 to about 2025.5 near 10^19.7. A pink curved arrow with a small arrowhead points up toward the trend line from the +150% / Year label. A rounded speech-style callout with a pointer, pale blue fill (#DAE5F1) and soft shadow sits above the 2023-2024 region, pointing down-right toward the trend line. A pale blue (#DAE5F1) oval with dark navy outline and soft shadow holds +150% / Year. The legend box at the lower right of the chart has a square pink marker with Leading AI supercomputers and a square grey-teal marker with Other AI supercomputers. Gridlines are light grey-blue, and the chart frame is a thin black rectangle. No photographs or logos other than the BOND wordmark.
Slide 19
…167% Annual Growth Over Four Years in…
Number of Powerful AI Models
Number of New Large-Scale AI Models (Larger than 10 FLOP*) – 2017-2024,
per Epoch AI
23
100
Number of New Models Released Each Year
Includes models from
• xAI
• Anthropic
• Meta
• NVIDIA
• Mistral
• Arc Institute
• & Others…
+167% /
Year
50
Both models from
DeepMind (AlphaGo
Zero & Master)
Publication Date
0
2017
2018
2019
2020
2021
2022
2023
2024
*As of 4/25, ‘Large-Scale AI Models’ are generally defined as those with a training compute of 10 FLOPs or greater, per Epoch AI.
Source: Epoch AI (5/25)
BOND
AI Technology Compounding = Numbers Behind The Momentum
18
Visuals: Chart: vertical bar chart titled 'Number of New Large-Scale AI Models (Larger than 10^23 FLOP*) – 2017-2024, per Epoch AI'. Y-axis titled 'Number of New Models Released Each Year', range 0 to 100 with labelled ticks at 0, 50 and 100, dashed light grey gridlines at 50 and 100 and a solid light grey baseline at 0. X-axis titled 'Publication Date' with categories 2017 to 2024. One series, dark blue #376092 bars with no printed data labels; bar heights about 2017 = 2, 2018 = 0, 2019 = 0, 2020 = 2, 2021 = 10, 2022 = 20, 2023 = 55, 2024 = 100 (values are estimates; only the axis is printed). No legend. Highlighted by a thin dark blue arrow rising from about the 2020 bar top to the 2024 bar top, with a callout ellipse '+167% / Year' on it. Callout 'Both models from DeepMind (AlphaGo Zero & Master)' points down to the 2017 bar. Callout 'Includes models from' points left toward the 2024 bar. Logo: BOND wordmark in a dark serif typeface at bottom left. No photographs.
Slide 20
ChatGPT AI User + Subscriber + Revenue Growth Ramps = / Hard to Match, Ever / ChatGPT User + Subscriber + Revenue Growth – 10/22-4/25, / per OpenAI & The Information / Users (MM) / Subscribers (MM) / Revenue ($B) / 800 / 20 / $4 / ChatGPT Weekly Active Users, MM / Subscribers , MM / Revenue, $B / 400 / 10 / $2 / 0 / 0 / $0 / 10/22 / 8/23 / 6/24 / 4/25 / 10/22 / 8/23 / 6/24 / 4/25 / 2022 / 2023 / 2024 / Note: 4/25 user count estimate from OpenAI CEO Sam Altman’s 4/11/25 TED Talk disclosure. Revenue figures are estimates based off OpenAI disclosures. Source: OpenAI / disclosures (as of 4/25), The Information (4/25) (link, link, link & link) / BOND / AI Technology Compounding = Numbers Behind The Momentum / 19
Visuals: Three line charts with dashed series and circular markers, no legend. Chart 1 'Users (MM)': y-axis 'ChatGPT Weekly Active Users, MM' ranging 0 to 800 with labelled ticks at 0, 400, 800; x-axis labelled 10/22, 8/23, 6/24, 4/25; six points, values about 0, 100, 200, 300, 400 and 800 (the 800 point is the labelled 4/25 estimate per the note); the last point sits at the top right. Chart 2 'Subscribers (MM)': y-axis 'Subscribers , MM' ranging 0 to 20 with ticks at 0, 10, 20; x-axis labelled 10/22, 8/23, 6/24, 4/25; four points, values about 0, 6, 15 and 20. Chart 3 'Revenue ($B)': y-axis 'Revenue, $B' ranging $0 to $4 with ticks at $0, $2, $4; x-axis labelled 2022, 2023, 2024; three points, values about $0.0, $1.0 and $3.7 (revenue figures are estimates per the note). All series are dark slate-blue dashed lines (about #3F5E8E) with hollow circular markers outlined in #4472C4 and white fill; gridlines at the labelled ticks are light grey dashed (#D9D9D9); axis baselines are thin light grey solid lines. No highlighted points. The BOND wordmark logo in black serif capitals bottom-left.
Slide 21
Time to 365B Annual Searches =
ChatGPT 5.5x Faster vs. Google
Annual Searches by Year (B) Since Public Launches of Google & ChatGPT – 1998-2025,
per Google & OpenAI
5,000
2,500
0
1
2
3
4
5
6
7
8
9
10 11 12 13 14 15 16 17 18 19 20 21 22 23 24 25 26 27
ChatGPT Hit 365B Annual
Searches in 2 Years (2024) vs.
Google’s 11 Years (2009)
Annual Searches, B
Years Since Public Launch (Google = 9/98, ChatGPT = 11/22)
Google Search
ChatGPT
Note: Dashed-line bars are for years where Google did not disclose annual search volumes. Source: Google public disclosures, OpenAI (12/24). ChatGPT figures are estimates per
company disclosures of ~1B daily queries
AI Technology Compounding = Numbers Behind The Momentum
20
Visuals: Chart: line chart, title 'Annual Searches by Year (B) Since Public Launches of Google & ChatGPT – 1998-2025, per Google & OpenAI'. Y-axis titled 'Annual Searches, B' ranging 0 to about 5,000, with labelled gridlines at 0, 2,500 and 5,000 (light grey dashed horizontal lines). X-axis titled 'Years Since Public Launch (Google = 9/98, ChatGPT = 11/22)' with categories 1 to 27 labelled every year. Series 1 'Google Search' (dark blue #2F5597 line with open circle markers, solid for years 1 to 3 and dashed for later segments): year 1 about 0, year 2 about 10, year 3 about 70, year 6 about 100, year 11 about 430, year 14 about 1,050, year 27 about 5,000 (only the 5,000 end point is at a gridline; other values are estimates). Series 2 'ChatGPT' (red #C0504D solid line with open circle markers): year 1 about 0, year 2 about 430. Legend below the plot: 'Google Search' with blue line and circle marker, 'ChatGPT' with red line and circle marker. Callout annotation in bold red text 'ChatGPT Hit 365B Annual Searches in 2 Years (2024) vs. Google’s 11 Years (2009)' with a thin red arrow pointing from the text down-left to the ChatGPT year-2 marker. The plot has no photograph, illustration or icon. Logo: BOND black serif wordmark bottom-left.
Slide 22
In 1998, tapping emerging Internet access, Google set out to
‘organize the world’s information and make it
universally accessible and useful.’
Nearly three decades later
– after some of the fastest change humankind has seen –
a lot of information is indeed digitized / accessible / useful.
The AI-driven evolution of how we
access and move information is happening much faster…
…AI is a compounder – on internet infrastructure, which allows
for wicked-fast adoption of easy-to-use broad-interest services.
21
AI Technology Compounding = Numbers Behind The Momentum
Visuals: none apart from the BOND wordmark logo at bottom left and the flat blue header band across the top; no photographs, charts, tables, icons or diagrams.
Slide 23
Knowledge Distribution Evolution =
Over ~Six Centuries
22
Slide 24
Knowledge Distribution – 1440-1992 =
Static + Physical Delivery…
Printing Press – Invented 1440
Source: Wikimedia Commons
BOND
Knowledge Distribution Evolution = Over ~Six Centuries
23
Visuals: One illustration: a black-and-white woodcut-style engraving of an early printing press in a workshop, shown upright and boxed with a thin black border, not cropped and not full-bleed. The press is at centre: a large wooden screw with two vertical handles at the top, a rectangular platen and frame with a pair of scissors, a brush and dividers hung on the wall, and a long bed with a sheet of type. A worker in a smock at left-centre pulls the bar with both hands, while a second, older man in a long robe stands behind him at left. At right a seated figure in a cap works at a bench beside a small window; a stack of printed sheets lies at right of the bed, and a small arched opening sits at lower right. Letters 'TS' and '20' are engraved on the lower wooden legs. Tones are pure black ink and white paper with hatched shading; no colour, no overlay, no tint. A small BOND logo is also present at bottom left: a black serif wordmark reading BOND, a logo image about 127 by 71 pixels.
Slide 25
…Knowledge Distribution – 1993-2021 =
Active + Digital Delivery…
Internet – Public Release 1993*
[Screenshot text, green on black]
The World Wide Web project
WORLD WIDE WEB
The WorldWideWeb (W3) is a wide-area hypermedia[1] information retrieval initiative aiming to give universal access to a large universe of documents.
Everything there is online about W3 is linked directly or indirectly to this document, including an executive summary[2] of the project, Mailing lists[3] , Policy[4] , November's W3 news[5] , Frequently Asked Questions[6] .
What's out there?[7] Pointers to the world's online information, subjects[8] , W3 servers[9], etc.
Help[10] on the browser you are using
Software Products[11] A list of W3 project components and their current state. (e.g. Line Mode[12] ,X11 Viola[13] , NeXTStep[14] , Servers[15] , Tools[16] , Mail robot[17] , Library[18] )
Technical[19] Details of protocols, formats, program internals etc
(ref.number), Back, <RETURN> for more, or Help:
*The internet is widely agreed to have been ‘publicly released’ in 1993 with release of the World Wide Web (WWW) into the public domain, which allowed users to create websites;
however, Tim Berners-Lee invented the World Wide Web in 1989, per CERN.
Source: Google, USA Department of Defense, CERN
Knowledge Distribution Evolution = Over ~Six Centuries
24
Visuals: One photographic-style screenshot of a 1993 line-mode web browser (CERN WWW, Line Mode) on a black field with bright green monospaced text, slightly blurred and glowing. The screen shows a title line top right, a centred heading WORLD WIDE WEB, indented paragraphs and a two-column menu of bracketed reference numbers, ending with a prompt line and a solid green block cursor at bottom centre. Full text is listed in the text field. Framing is a rectangle, not cropped, full screen visible, with dominant colours black #000000 and green about #22DD22. No overlay or tint. The BOND wordmark is a small serif logo in black at bottom left.
Slide 26
…Knowledge Distribution – 2022+ = / Active + Digital + Generative Delivery / Generative AI – Public Launch of ChatGPT 2022* / ChatGPT 4o / Great, I'll gather quantitative global data on how generative AI is impacting knowledge generation and distribution across all major sectors—including education, research, media, and more. / I'll let you know as soon as the findings are ready. / Research completed in 5m · 25 sources · 116 searches / Global Impact of Generative AI on Knowledge Generation and Distribution / Global Impact of Generative AI on Knowledge Generation & Distribution / Generative AI's rapid advancement since 2022 has led to an explosion in AI-created content and widespread adoption across sectors. Below we compile quantitative global data (2023–2025) illustrating how generative AI is transforming knowledge generation (content creation) and distribution (sharing and access) in academia, media, education, enterprise, and beyond. / Surge in AI-Generated Content Creation / Academic Publications: AI is now contributing to scientific literature. An analysis found that 1% of all scientific articles published in 2023 showed signs of generative AI involvement [source chip] . This amounts to an estimated 60,000 research papers potentially written (in part) by large language models [source chip] . Top journals have responded – by late 2023, 87 of the 100 leading journals had issued guidance on using AI tools in writing [source chip] – reflecting how commonplace AI-assisted writing has become in research. / News and Media Content: Generative AI is also writing the news. By mid-2024, about 6.96% of global news articles were AI-generated – roughly 60,000 AI-written news articles published per day [source chip] . Misinformation trackers have identified 1,271 news and information websites across 16 languages that rely on AI-generated content with minimal human oversight (as of May 2025) [source chip] , a sharp rise from 467 such sites in 2023 [source chip] . Even reputable outlets use AI for routine reporting: the Associated Press, for example, was automatically generating 40,000 of its 730,000 news stories (5.5%) via AI by mid-2023 [source chip] . This automation has enabled greater volume and speed in news dissemination. / *We define the public launch of ChatGPT in November 2022 as the public release of Generative AI which we see as AI’s ‘iPhone Moment.’ ChatGPT saw the fastest user ramp ever for / a standalone product (5 days to secure 1MM users). Generative AI = AI that can create content – text, images, audio, or code – based on learned patterns. / Source: OpenAI / Knowledge Distribution Evolution = Over ~Six Centuries / 25 / BOND
Visuals: One photograph-like screenshot of a ChatGPT 4o browser/app window, placed in a thin dark-grey bordered rectangle, not cropped on the sides, with its bottom edge cut off by the box at the lower text lines. Subject: a generated research report titled Global Impact of Generative AI on Knowledge Generation & Distribution, with bulleted paragraphs on academic publications and news content. Composition: full-width interface with a white canvas; the central reading column (about 27% to 73% across) holds a light-grey bordered card containing the report. Lighting: flat, even screen light; no shadows. Dominant colours: white, near-black text, mid-grey secondary text, a faint light-grey card border, and a black circular avatar at top right. Small grey pill-shaped source chips appear inline after several sentences, too small to read. No overlay or tint. No logos other than the small ChatGPT sparkle icon at top centre-left of the reading column and the Share button and menu icons at top right.
Slide 27
Knowledge is a process of piling up facts; / wisdom lies in their simplification. / Martin H. Fischer, German-born American Physician / Teacher / Author (1879-1962) / 26 / Knowledge Distribution Evolution = Over ~Six Centuries / BOND
Visuals: None apart from the small BOND wordmark logo in the bottom-left corner. It is a black, high-contrast serif wordmark reading BOND in capitals on a white ground, placed as a raster image of 127 by 71 pixels. No photographs, charts or diagrams.
Slide 28
AI = / Many Years Before Lift-Off / BOND / 27
Slides 29 to 340 continue in the full text file.
Download this deck
The hosted PDF of every library deck is free for readers of the SlideDeck Co newsletter. Join with your email and the viewer and download appear here.
Preparing a results presentation or business update of your own? The SlideDeck Co Standard Deck is a slide library for business reviews, updates and plans.







