
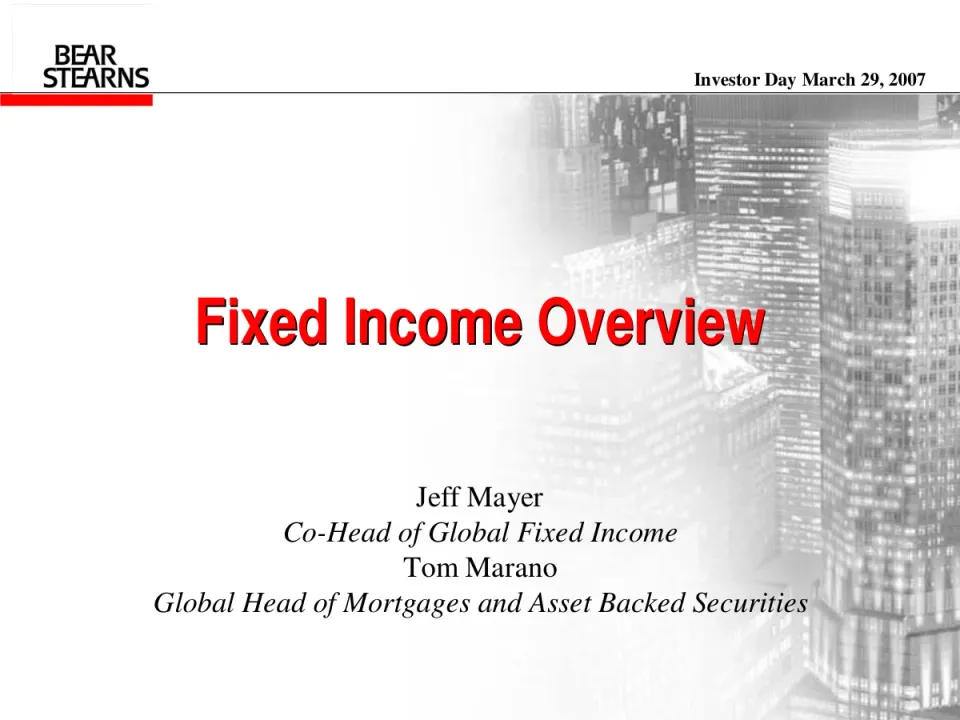
The deck opens with a title slide naming the Fixed Income Overview and presenters Jeff Mayer and Tom Marano, followed by a headline-led look at the division's growth. Total fixed income net revenues have roughly doubled since 2002, and a bridge chart attributes that growth to mortgage-backed securities, credit and interest rate businesses. Sections then cover the credit franchise, including credit trading, leveraged finance and distressed debt, and credit derivatives volumes. The interest rate and foreign exchange business follows, then a long mortgage section on origination platforms, servicing, securitization rankings, the mortgage research team, commercial mortgages and CDO/CLO activity. Later slides address sub-prime exposure and hedging tools such as the ABX index, with charts of spread changes and tables of the cost of spread widening. The deck closes with a forward-looking statements disclaimer, after which the title slide is repeated. Slides worth studying include the revenue bridge on slide 3, the credit derivatives volume chart on slide 5, and the origination platform charts on slides 10 to 12, each pairing one headline claim with a clear supporting chart.
Slides worth studying
- Slide 3: A waterfall bridge chart shows how each business adds to total revenue growth, so the single message reads at a glance.
- Slide 5: A dual-axis chart pairs volume bars with trade counts and carries the point in its subtitle.
- Slide 10: One large claim sits above a short bullet list and a simple bar chart, keeping text and data balanced.
Questions about this deck
What does the Bear Stearns Fixed Income Overview deck say about its net revenue growth since 2002?
Slide 2 says Bear Stearns net revenues have doubled since 2002, with a CAGR of 22%, and shows the figures $1,909 and $4,190 on a chart labelled billions for 2002 and 2006. Slide 3 attributes the growth mainly to the credit and mortgage franchises.
How many slides does the Bear Stearns Fixed Income Overview deck have?
The Bear Stearns Fixed Income Overview deck has 26 slides. The forward-looking statements disclaimer appears on slide 21, and the title slide is repeated on slide 22.
What does the Bear Stearns deck say about its sub-prime exposure?
Slide 20 states that less than 3% of 2006 MBS revenue came from sub-prime. It also reports a 50% decline in 2006 sub-prime acquisitions compared with a 5% market decline.
What does the Bear Stearns deck say about its Bear Res mortgage origination volume?
Slide 10 says Bear Residential Mortgage Corporation originated $4.8 billion in loans in 2006, up from $400 million in 2005. The same slide describes a network of over 6,000 approved brokers and correspondents.
Details
- Company: Bear Stearns
- Year: 2007
- Type: Investor presentation
- Industry: Investment banking
- Pages: 26
Review score: 7 out of 10, Effective
Presentation quality, judged with the SlideDeck Co review heuristic. Ask, evidence and idea merit are not rated here.
The deck follows a clear route from the growth headline (slides 2-3) through credit, interest rate and a long mortgage section, using a consistent template, red titles and a section tag system (Origination, Servicing, Securitization, Research, Commercial, CDO/CLO) that helps orientation. Most pages pair one point with one chart and the charts are plain and readable, as in slides 3, 5 and 10. Weaknesses are consequential: slides 2, 3 and 5 have chart titles but no takeaway headline, many slides are text-heavy with tiny sub-bullets (4, 7, 19), and dual-axis charts such as slides 5 and 6 give the reader extra work. The close is weak, with the disclaimer on slide 21 placed mid-deck before the hedging tables, a repeated title slide on 22, and unannotated tables on 25-26 that rely on a presenter.
Worth keeping: Keep the disciplined template, the section tag system, and the one-claim-plus-one-chart pairing on slides 3, 5 and 10.
Most useful repair: Replace topic titles with takeaway headlines on slides 2, 3 and 5, fix the order of the disclaimer and repeated title slide, and add callouts to the dense tables on slides 25-26.
What would change the score: I would cut bullet text on slides 4, 7, 9 and 19 to the few figures that matter, enlarge the small chart labels on slides 6 and 12, and simplify the dual-axis charts.
Confidence high. 26 of 26 pages inspected on contact sheets, 4 at readable size. Reviewed 2026-11-09. Model-assisted review (claude-sonnet-5-5).
Full text of the slides (26 slides)
Every slide's words and a description of its charts and images, so the deck can be searched and rebuilt. Also available as Markdown.
Slide 1
BEAR STEARNS
Investor Day March 29, 2007
Fixed Income Overview
Jeff Mayer
Co-Head of Global Fixed Income
Tom Marano
Global Head of Mortgages and Asset Backed Securities
Visuals: Photograph of a city skyline with tall glass office towers seen from street level, rendered in greyscale with high contrast and window grids. The image is full-bleed on the right side and fades into white via a left-facing gradient mask, running from about 45% of width to the right edge and from the header rule to the bottom edge. Dominant colours are mid grey, light grey and white. Logo: Bear Stearns wordmark in black sans-serif capitals, two lines ('BEAR' over 'STEARNS'), with a red (#E00000) rectangular bar beneath it.
Slide 2
BEAR STEARNS
Net Revenues have Doubled Since 2002
CAGR = 22%
$4,190
$3,293
$3,147
$2,907
$1,909
billions
2002
2003
2004
2005
2006
Prior period net revenues reclassified to conform to current reporting.
2
Visuals: Column chart of net revenues, titled implicitly by the slide headline. Y-axis labelled 'billions' (rotated vertical text, no tick values shown). X-axis categories 2002, 2003, 2004, 2005, 2006 with tick marks between bars. Single series of five grey bars (#C0C0C0) with black 1px outlines. Labelled values: 2002 $1,909; 2003 $2,907; 2004 $3,147; 2005 $3,293; 2006 $4,190. Bars are of nearly equal width, evenly spaced. A thin black arrow rises from about the top of the 2002 bar area to upper right above the 2006 bar, indicating growth, with label 'CAGR = 22%' in bold black serif above its left portion. No legend. No highlighted points. Bar heights are proportional to values with baseline at about 86% y.
Slide 3
BEAR STEARNS
Led by the Growth of the Credit and Mortgage / Franchises
Contribution to Growth in Fixed Income Net Revenues 2002–2006
$327
$4,190
$1,027
$927
$1,909
billions
2002
MBS
Credit
Interest Rate
2006
Prior period net revenues reclassified to conform to current reporting.
3
Visuals: Chart: waterfall-style column chart. Title: 'Contribution to Growth in Fixed Income Net Revenues 2002–2006' (printed above the plot). Y-axis: unlabelled numeric scale; the only axis text is the rotated label 'billions' (units in billions of dollars), no tick values or range printed; bar heights are not drawn to a numeric scale, so values are only given by the data labels. X-axis: category labels 2002, MBS, Credit, Interest Rate, 2006; baseline is a black horizontal line with five short downward tick marks at category boundaries. Series (one series, five floating or total bars, all with printed values): 2002 total $1,909 (dark grey bar, bottom at baseline); MBS contribution $927 (light grey floating bar); Credit contribution $1,027 (light grey floating bar); Interest Rate contribution $327 (light grey floating bar, the shortest); 2006 total $4,190 (light grey bar, the tallest, rising from baseline to the top of the plot). Each bar has a thin black outline. Labels are bold serif values placed just above each bar. No legend. No highlighted points beyond the darker 2002 bar. Bars: 2002 about 0.7 of 2006 height; floating bars stacked in ascending steps from left to right.
Slide 4
The Franchise Continues to Grow: Credit
Credit products continue to produce record revenues
Credit Trading
Record revenues in 2006 well surpassed prior year record
Global franchise with U.S., Europe and Asia all contributing
Leveraged Finance
Jointly managed with Investment Banking
Sixth consecutive year of record net revenues
Lead managed bank and bond deal volumes at record levels
Distressed Debt
Record revenues in 2006
Strong research, client relationships and distribution capabilities
4
Visuals: Logo: Bear Stearns wordmark in black, stacked two-line sans-serif capitals ('BEAR' over 'STEARNS') at top-left, about x 4% y 4%, w 13% h 9%. Horizontal black rule spanning full width at about 13% height. Short solid red bar at top-left under the logo, about x 0% y 13% w 16% h 1.3%. Red square bullet markers (❑ style) beside the three primary headings and small red dash markers beside the sub-bullets. No charts, photographs or tables.
Slide 5
Credit Derivatives
Growth Trend Continues During First Quarter
Volume up 64% over 1Q2006
$4.0
$3.0
$2.0
$1.0
$0.0
160,000
120,000
80,000
40,000
0
trillions
Trade Volume
Volume
No. of Trades
2002
2003
2004
2005
2006
5
Visuals: Combination chart: grey columns (Volume) and a red line with diamond markers (No. of Trades) on two value axes. Chart title (bold serif, two lines): 'Growth Trend Continues During First Quarter' / 'Volume up 64% over 1Q2006'. Left y-axis titled 'trillions', labelled $0.0 to $4.0 in steps of $1.0, gridline at top only. Right y-axis titled 'Trade Volume', labelled 0 to 160,000 in steps of 40,000. X-axis categories 2002, 2003, 2004, 2005, 2006 with tick marks between categories. Volume series (grey bars, values about, since none are printed): 2002 about $0.05 trillion; 2003 about $0.10 trillion; 2004 about $0.27 trillion; 2005 about $1.20 trillion; 2006 about $3.40 trillion. No. of Trades series (red line, values about, since none are printed): 2002 about 8,500; 2003 about 15,000; 2004 about 27,000; 2005 about 87,000; 2006 about 139,000. Legend boxed at upper left of plot area: grey filled rectangle labelled 'Volume' above a red line with diamond marker labelled 'No. of Trades'. Highlighted points: none beyond the markers on the line. The 2006 bar is the tallest and the 2006 diamond sits just above its top.
Slide 6
BEAR STEARNS
Strategic Effort to Deepen Relationships with Financial Sponsors Continues to Fuel Business Opportunities in 1Q 2007
Lead Managed Bond Deals(1)
billions
$8 $6 $4 $2 $0
50 40 30 20 10 0
2002 2003 2004 2005 2006
$1.5 $5.2 $4.7 $2.5 $5.7
13 30 43 25 27
League Table Volume No. of Issues
Lead Arranged Bank Deals(2)
billions
$15 $12 $9 $6 $3 $0
50 40 30 20 10 0
2002 2003 2004 2005 2006
$0.8 $2.2 $5.8 $7.7 $13.8
4 14 30 33 41
League Table Volume No. of Deals
(1) Source: Bloomberg High Yield Underwriter Rankings.
(2) Source: Reuters Loan Pricing Corp.
6
Visuals: Two combo charts. Left chart: title 'Lead Managed Bond Deals(1)'; left y-axis 'billions' from $0 to $8 in $2 steps; right y-axis 0 to 50 in steps of 10 (no axis title); x-axis years 2002 to 2006. Series 1, grey bars labelled 'League Table Volume': $1.5 (2002), $5.2 (2003), $4.7 (2004), $2.5 (2005), $5.7 (2006). Series 2, red line with diamond markers labelled 'No. of Issues': 13 (2002), 30 (2003), 43 (2004), 25 (2005), 27 (2006). Legend below the chart: grey box then red line with diamond. Right chart: title 'Lead Arranged Bank Deals(2)'; left y-axis 'billions' from $0 to $15 in $3 steps; right y-axis 0 to 50 in steps of 10; x-axis years 2002 to 2006. Grey bars labelled 'League Table Volume': $0.8 (2002), $2.2 (2003), $5.8 (2004), $7.7 (2005), $13.8 (2006). Red line with diamond markers labelled 'No. of Deals': 4 (2002), 14 (2003), 30 (2004), 33 (2005), 41 (2006). Legend below the chart. No highlighted points. Bars are mid-grey with black outlines; the line is red with thin strokes.
Slide 7
The Franchise Continues to Grow: Interest Rate
Broadening the franchise to both integrate cash and derivative businesses and launch new product areas
Interest Rate
Integrating cash and derivative businesses
Global franchise with significant operations in Europe and Asia
Foreign Exchange
Expanding precious metals business, already profitable in first full year
Investing in electronic trading platforms and technology
Local Markets group formed
7
Visuals: Bear Stearns logo in the top-left corner: the black wordmark 'BEAR' over 'STEARNS' in a bold condensed sans-serif, with the letter A's crossbar and the E's middle bar drawn as stylised red-free black marks. Above it, a thin grey outline box frames the logo area. Below it, a full-width black horizontal rule and a solid red rectangle at the left under the logo. Bullets are red Wingdings-style square glyphs for the two main headings and pale red dash glyphs for sub-points. No charts, photographs or diagrams.
Slide 8
Our Market Leading Mortgage Franchise Continues to Grow
Origination
Captive origination increased significantly in 2006
Servicing
Servicing over 500,000 loans
Securitization
Top ranked underwriter of MBS and ABS
Research
Top ranked research analysts
Commercial
Global CMBS platform
CDO/CLO
Market leader in CDO/CLO space
8
Visuals: Bear Stearns logo at top left (black serif-style wordmark 'BEAR' over 'STEARNS' on white). Six solid rectangular label boxes stacked in a column, each with white bold serif text: Origination (light grey), Servicing (charcoal), Securitization (mid grey), Research (muted slate blue), Commercial (indigo blue), CDO/CLO (navy). Each label has a red square bullet glyph beside its statement in the right column. A thin black horizontal rule runs full width below the logo and a red bar sits at the left under the rule. No photographs, charts or tables.
Slide 9
Expanding Origination Capability
Origination
Growing captive origination platform provides a steady source of quality product for capital markets activities
Three domestic captive origination channels accounted for 35% of securitizations in Q1 2007:
Bear Residential Mortgage Corporation (“Bear Res”)
Alt-A wholesale originator launched in April 2005
Encore Credit Corporation (“Encore”)
Sub-prime wholesale originator acquired in February 2007
EMC Mortgage Corporation (“EMC”)
Alt-A and Sub-prime conduit operation
Two European sub-prime mortgage originators:
Rooftop – United Kingdom
Bearimmo – France
9
Slide 10
BEAR STEARNS / Bear Residential Mortgage Corporation / Alt-A Wholesale Platform / Origination / Over the past 2 years we have built a highly scalable, state-of-the-art origination platform / Originated $4.8 billion in loans in 2006, up from $400 million in 2005 / Web portal and automated underwriting engine enable fast & efficient loan processing / Network of over 6,000 approved brokers & correspondents / millions / $2,000 / $1,500 / $1,000 / $500 / $0 / 1Q05 2Q05 3Q05 4Q05 1Q06 2Q06 3Q06 4Q06 / Bear Res Origination / 10
Visuals: Bar chart titled none, with legend 'Bear Res Origination' in top-right of plot area. Y-axis labelled 'millions', range $0 to $2,000, ticks at $500 intervals. X-axis quarters 1Q05 to 4Q06 (8 categories). Series 'Bear Res Origination' bars in medium grey (about #999999) with black outlines; approximate values: 1Q05 about 0, 2Q05 about 15, 3Q05 about 140, 4Q05 about 280, 1Q06 about 520, 2Q06 about 970, 3Q06 about 1,520, 4Q06 about 1,740 (values estimated, not printed). No highlighted points. Bear Stearns logo top-left in black.
Slide 11
Encore Credit Corporation
Sub-prime Wholesale Platform
Origination
Encore acquisition in February 2007 doubled our wholesale origination capacity and diversified our product mix.
Originated $6.1 billion of loans in 2006
Purchased assets and compatible platform at an attractive price
Network of nearly 10,000 approved brokers & correspondents
Platform will leverage Bear Res technology platform as well as Bear Stearns research and capital markets expertise
$2,000
$1,500
$1,000
$500
$0
millions
Encore Origination
1Q06
2Q06
3Q06
4Q06
11
Visuals: Column bar chart on the right. Type: vertical column chart, no chart title. Y-axis: labelled millions, rotated vertical, linear scale from $0 to $2,000 with tick labels $0, $500, $1,000, $1,500, $2,000. X-axis: categories 1Q06, 2Q06, 3Q06, 4Q06. Single series 'Encore Origination' with columns filled mid grey (about #999999) and black outlines; no data labels printed, so values are about 1Q06 $1,730 million, about 2Q06 $1,520 million, about 3Q06 $1,280 million, about 4Q06 $1,570 million. Legend at top inside plot: grey square swatch followed by 'Encore Origination'. No highlighted points. Chart axes are black lines with outside tick marks. Also a small logo at top left: the BEAR STEARNS wordmark in black bold condensed sans-serif capitals stacked on two lines, with a thin grey outline box. Red square bullets are decorative glyphs in the list.
Slide 12
BEAR STEARNS
EMC Mortgage Corporation
Alt-A and Sub-prime Conduit
Origination
EMC is a top Alt-A and Sub-prime conduit, comprised of three main channels:
Bulk
Acquire large pools which are competitively bid
$36.2 billion of 2006 acquisitions
Flow
Approximately 500 approved sellers
$29.6 billion of 2006 acquisitions
Scratch & Dent
Marker leader in acquisitions of distressed and scratch & dent loans
$3.4 billion of 2006 acquisitions
$ in millions
30,000
25,000
20,000
15,000
10,000
5,000
0
Q1 '05 / Q2 '05 / Q3 '05 / Q4 '05 / Q1 '06 / Q2 '06 / Q3 '06 / Q4 '06 / Q1 '07
Bulk
Flow
Scratch & Dent
12
Visuals: Stacked column chart. Title: none printed. Y axis: '$ in millions', range 0 to 30,000, gridlines absent, tick labels 0, 5,000, 10,000, 15,000, 20,000, 25,000, 30,000. X axis: nine quarters, Q1 '05 through Q1 '07 in two-line labels. Series stacked bottom to top: Bulk (mid-grey #999999), Flow (dark blue #333399), Scratch & Dent (red #FF0000), each segment outlined in black 1 px. No values are printed; estimated values (about, in $ millions): Q1 '05 Bulk about 15,700, Flow about 3,400, Scratch about 800; Q2 '05 Bulk about 11,700, Flow about 6,000, Scratch about 900; Q3 '05 Bulk about 16,400, Flow about 9,700, Scratch about 1,300; Q4 '05 Bulk about 13,700, Flow about 10,000, Scratch about 700; Q1 '06 Bulk about 9,500, Flow about 10,500, Scratch about 900; Q2 '06 Bulk about 10,700, Flow about 6,600, Scratch about 1,000; Q3 '06 Bulk about 6,200, Flow about 6,500, Scratch about 900; Q4 '06 Bulk about 9,600, Flow about 5,900, Scratch about 800; Q1 '07 Bulk about 6,900, Flow about 5,300, Scratch about 1,100. Legend: horizontal, top of plot area, Bulk / Flow / Scratch & Dent with small coloured squares. No highlighted points. Red square bullet markers in the text column are icons.
Slide 13
BEAR STEARNS
Rooftop and Bearimmo
Sub-Prime Wholesale Platforms
Origination
Over the past 3 years, we have established sub-prime origination platforms in the United Kingdom and France.
Both platforms built organically
Rooftop originated $1.7 billion in 2006
Bearimmo growing rapidly, with current monthly originations of $25 million
13
Visuals: Logo: Bear Stearns wordmark in black uppercase sans-serif, two lines, 'BEAR' over 'STEARNS', top-left at about x 4%, y 4%, w 12%, h 9%. Red square bullet glyphs (❑ style) before each of the three bullet points. Grey rectangular label box behind the word 'Origination'. No charts, photographs or diagrams.
Slide 14
BEAR STEARNS / EMC Mortgage Corporation / Servicing / EMC continues to be a top rated servicer with a new management team driving automation and innovation. / Market leader as specialty servicer, with over 15 years of experience / Currently servicing 504,177 loans with balances of $77.9 billion / Servicing varied types of loans / Alt A, Sub-prime, Prime, Seconds, Option ARMs, HELOCs and 'Scratch and Dent' / Since 2000, the number of loans serviced has quadrupled and balances have increased eleven-fold / In the last year, EMC has hired 18 Senior Managers, averaging more than 19 years of industry experience / 600 / 500 / 400 / 300 / 200 / 100 / 0 / $100 / $75 / $50 / $25 / $0 / 2000 / 2001 / 2002 / 2003 / 2004 / 2005 / 2006 / 1Q07 / Number of Units / Unpaid Balances / 14
Visuals: Combo chart titled none printed. Type: clustered column plus line with markers on a secondary axis. Primary y-axis (left, units: number of units, no unit label printed) ranges 0 to 600 in steps of 100. Secondary y-axis (right, dollars, no unit label printed) ranges $0 to $100 in steps of $25. X-axis categories: 2000, 2001, 2002, 2003, 2004, 2005, 2006, 1Q07. Series 'Number of Units' (grey columns, about values): 2000 about 127, 2001 about 129, 2002 about 175, 2003 about 175, 2004 about 245, 2005 about 455, 2006 about 477, 1Q07 about 507. Series 'Unpaid Balances' (dark blue line with diamond markers, about values on $ axis): 2000 about $8, 2001 about $8, 2002 about $12, 2003 about $15, 2004 about $28, 2005 about $60, 2006 about $70, 1Q07 about $78. Legend top-left inside plot: grey rectangle 'Number of Units', blue line with diamond 'Unpaid Balances'. No highlighted points. Logo: Bear Stearns wordmark top-left in black, two lines 'BEAR' / 'STEARNS'.
Slide 15
BEAR STEARNS
Bear Stearns Mortgage Facilities
Santa Ana, CA (Bear Res)
Irvine, CA (Encore)
Irvine, CA (EMC)
Scottsdale, AZ
Scottsdale, AZ (Pima)
Irving, TX
Downners Grove, IL
King of Prussia, PA
Glen Allen, VA
United Kingdom
London (Rooftop)
France
Paris (Bearimmo)
Map Key
Current States: 38 States
Utilization Key
0% - 50%
50% - 100%
15
Visuals: Map of the contiguous United States, filled by state: about 38 states in dark red (crimson) and the rest in mid grey (Idaho, Montana, Wyoming, North Dakota, South Dakota, Nebraska, Iowa, Missouri-adjacent Arkansas, Tennessee, Louisiana, Mississippi edge areas and Utah-to-Nevada grey not all listed). Callout labels with leader lines point to facility locations: Santa Ana, CA (Bear Res) in light blue-grey, Irvine, CA (Encore) light blue-grey, Irvine, CA (EMC) yellow, Scottsdale, AZ light blue-grey, Scottsdale, AZ (Pima) light blue-grey, Irving, TX yellow, Downers Grove, IL yellow, King of Prussia, PA yellow, Glen Allen, VA yellow, London (Rooftop) yellow, Paris (Bearimmo) yellow. United Kingdom inset: grey map of Great Britain and Ireland in a thin black-outlined box. France inset: grey map of France with Corsica in a thin black-outlined box. Map Key legend box with a crimson swatch for Current States: 38 States. Utilization Key legend box with a yellow swatch for 0% - 50% and a light blue swatch for 50% - 100%.
Slide 16
BEAR STEARNS / Market Leader in Securitization Activity / Securitization / Our franchise retained its leading rank in the MBS market and / increased penetration into several new sectors in 2006. / Ranked #1 in U.S. MBS(1) in 2006 for the third year in a row / $113 billion in 2006 securitizations / Consistently ranked in the top 5 for the last 20 years / Ranked #1 in U.S. ARMs(1) / $43 billion in 2006 securitizations / Top ranked every year since inception of ranking (2002) / Became Top 5 ranked Global CDO underwriter in 2006 / $23 billion in 2006 securitizations / Volume nearly doubling from last year / Originated a record $12.6 billion in Global CMBS / $15.5 billion in 2006 securitizations / Transactions in Europe, Asia and Latin America / (1) Source: Thomson Financial. / 16
Slide 17
BEAR STEARNS / Mortgage Research Team / Research / Our top ranked(1) analytics team is a key driver of our success. / In 2006, 7 research analysts were recognized in 9 categories, up from 4 analysts in 7 categories in 2005 / Since 2001, our research staff has earned 39 total team positions including, 13 first team awards / Ranked #1 in MBS Prepayments since 1993 (14 years) / Top 2 in ABS Prepayments every year since 2001 / Top 3 in MBS Non-Agency every year since 2001 / (1) Source: Institutional Investor. / 17
Visuals: Logo: Bear Stearns wordmark in black uppercase letters, two lines 'BEAR' over 'STEARNS', at top left. Decorative elements: a full-width thin black horizontal line and a short solid red bar beneath the logo; no photographs or charts. Bullets are red square-shaped glyphs (small filled squares with a check-like tick, Wingdings-style). The purple box labelled 'Research' is a filled rectangle with white serif text.
Slide 18
BEAR / STEARNS
Commercial Mortgages
Commercial
In 2006, we firmly established Bear Stearns as a global presence in / commercial real estate finance.
Originated over $12.6 billion in / 2006, more than double 2004 levels
Able to apply securitization / expertise to acquisition finance
Equity Office Properties
The Blue City, Sultanate of Oman
Daikoku Distribution Center, Yokohama
180 UK petrol stations leased to Shell
Global franchise
24% of 2006 production from non-U.S. / sources
Offices in New York, Los Angeles, / London, Tokyo and Frankfurt
$14,000
$12,000
$10,000
$8,000
millions
$6,000
$4,000
$2,000
$0
2003
2004
2005
2006
Commercial Loan / Originations
18
Visuals: Bar chart, vertical columns. Title: none printed; legend reads 'Commercial Loan Originations' with a grey square key, placed inside the plot top-left. Y-axis labelled 'millions', range $0 to $14,000 with ticks every $2,000 (labels $0, $2,000, $4,000, $6,000, $8,000, $10,000, $12,000, $14,000). X-axis categories 2003, 2004, 2005, 2006. Single series, grey columns (about #999999) with black outlines. Values not printed; estimated values: 2003 about $3,650 million, 2004 about $6,650 million, 2005 about $11,900 million, 2006 about $12,700 million. No highlighted points. Axes are black lines with outward tick marks.
Slide 19
BEAR STEARNS
CDOs/CLOs
CDO/CLO
CDOs
Top 5 ranked Global CDO underwriter in 2006
Volume nearly doubling from 2005
Diverse and balanced range of CDO Business
CLOs, ABS CDOs, CDOSquared, CMBS, Trust Preferred
Continued growth in London-based CDO origination, reaching $3.4 billion
Broad based distribution platform through team in New York, London, Tokyo, Hong Kong and Singapore
Approximately 40% of CDO debt classes and 52% of CDO equity classes placed internationally
Strong pipeline of deals for the remainder of the year - over $15 billion in committed mandates
CLOs
Major distribution channel for leverage loan-related credit
19
Visuals: Logo: Bear Stearns wordmark in black sans-serif capitals stacked on two lines (BEAR over STEARNS) at top left. A thin black horizontal rule runs the full width at about 13% height, and a solid red bar sits below the logo at left, about 0 to 16% width. No photographs, charts or diagrams.
Slide 20
Bear Stearns / Limited Sub-prime Exposure / We are well positioned to handle disruption in the sub-prime market / Insignificant Revenue Contribution / <3% of 2006 MBS revenue came from sub-prime / Modest Warehouse Exposure / No exposure to headline companies / Decreased Loan Acquisitions / 50% decline in 2006 sub-prime acquisition vs. 5% market decline / Bear Volume / Market Volume(1) / Bear Volume ($ in billions) / Market Volume ($ in billions) / $0 $5 $10 $15 $20 / 0 100 200 300 400 500 600 700 / 2003 2004 2005 2006 / (1) Market volumes (ABS Home Equity Issuance). / 20
Visuals: Combined bar and line chart. Title: none printed. Left y-axis: 'Bear Volume ($ in billions)', range $0 to $20, ticks at $0, $5, $10, $15, $20. Right y-axis: 'Market Volume ($ in billions)', range 0 to 700, ticks every 100. X-axis categories: 2003, 2004, 2005, 2006. Series 1, Bear Volume, grey bars (#999999) with black outline: about $2 (2003), about $13.3 (2004), about $18.3 (2005), about $9.1 (2006); no values printed, so these are estimates. Series 2, Market Volume(1), red (#FF0000) line with red diamond markers: about 230 (2003), about 380 (2004), about 625 (2005), about 600 (2006); no values printed, so these are estimates. Legend at top inside plot: grey rectangle swatch labelled 'Bear Volume' and red line-with-diamond swatch labelled 'Market Volume(1)'. No highlighted points beyond the markers.
Slide 21
Bear Stearns / Certain statements contained in this discussion are “forward-looking statements” / within the meaning of the Private Securities Litigation Reform Act of 1995. / Forward-looking statements are subject to risks and uncertainties, which could cause / actual results to differ materially from those forward-looking statements. Numerous / factors may affect our business, including but not limited to interest rates, market / conditions, transactions included in our backlog failing to close, general economic / conditions in the US or other geographic regions that may suffer economic / downturns. For a fuller discussion of these risks see “Management’s Discussion and / Analysis of Financial Condition and Results of Operations” and “Risk Management” / in the Company’s Annual Report to Stockholders, which has been filed with the / Securities and Exchange Commission. / The information in this document is provided by Bear Stearns for informational / purposes only, and should be considered current only as of the date of its initial / publication, without regard to the date on which you may actually review the / information. / 21
Slide 22
BEAR STEARNS
Investor Day March 29, 2007
Fixed Income Overview
Jeff Mayer
Co-Head of Global Fixed Income
Tom Marano
Global Head of Mortgages and Asset Backed Securities
Visuals: Photograph of a city skyline of tall office towers, rendered in greyscale, occupying the right half of the slide from about x=45% to full width and full height; the towers fade into white on their left edge via a soft gradient, so the photo is full-bleed on the right and blends into the white background. The image shows a dense cluster of glass-curtain-wall skyscrapers viewed from street level looking upward, with horizontal floor lines and a vertical tower at right-centre. Greyscale tones dominate, from light grey to mid-dark grey, with bright white highlights on the glass. The photo carries no overlay or tint. A red bar sits below the logo at top-left.
Slide 23
RMBS Hedging
The development of Pay-As-You-Go (“PAUG”) credit default swaps and the ABX Index provides hedging tools to investors.
PAUG CDS mimic the cash flows of a cash bond, allowing investors to go long or short the risk of a bond (CUSIP specific) with no limitations to the size of the trade
The ABX Index is an index reflecting the performance of 20 PAUG CDS, allowing investors to take short or long positions in a basket of sub-prime securitizations:
The ABX Index is divided into 3 series referencing issuances in 2nd half 2005, 1st half 2006 and 2nd half 2006
Each ABX series has 5 sub-indices (AAA, AA, A, BBB, BBB-) referencing the tranche with that respective rating
23
Slide 24
BEAR STEARNS
Increase in Spreads of HEQ Securitization & ABX
From 11/30/06–3/26/07
% Increase in HEQ & ABX
350.00%
300.00%
250.00%
200.00%
150.00%
100.00%
50.00%
0.00%
ABX 06-2 BBB
ABX 06-2 BBB-
BSABS 06-HE9 to
BSABS 07-HE3
Absolute
11/30/2006
1.95%
3.02%
1.01%
Spreads
3/26/2007
7.66%
12.59%
1.61%
% Change
292.3%
316.8%
59.9%
24
Visuals: Vertical bar chart. Title: 'From 11/30/06–3/26/07' (printed above the plot, centred). Y-axis: '% Increase in HEQ & ABX', range 0.00% to 350.00%, gridlines and tick labels every 50.00% (0.00%, 50.00%, 100.00%, 150.00%, 200.00%, 250.00%, 300.00%, 350.00%). X-axis categories: 'ABX 06-2 BBB', 'ABX 06-2 BBB-', 'BSABS 06-HE9 to BSABS 07-HE3'. Series: one series, navy bars with thin black outlines. Bar values are not printed on the chart; estimated heights: ABX 06-2 BBB about 292%, ABX 06-2 BBB- about 317%, BSABS 06-HE9 to BSABS 07-HE3 about 60%. No legend. No highlighted points. Below the chart is a table with three rows and four value columns (first column labels). Row 1 'Absolute Spreads' label with 11/30/2006 | 1.95% | 3.02% | 1.01%. Row 2 '3/26/2007' | 7.66% | 12.59% | 1.61%. Row 3 '% Change' | 292.3% | 316.8% | 59.9% (bold). Thick black horizontal rules separate row 1 from row 2 and row 2 from row 3, spanning the value columns. Column headings are not printed.
Slide 25
BEAR STEARNS / Cost of Spread Widening—Unhedged Sub-Prime Securitization / 6bps wider in / AAA & AA / Ratings / Issuance / % of Capital / Market Spread / 50bps wider in / Class / Size (000s) / Structure / (in bps) / A / BBB / BB / AAA / $ 432,783 / 75.5% / 11 / $ (484,048) / AA / 75,163 / 13.1% / 27 / $ (177,370) / A / 31,914 / 5.6% / 44 / $ (586,755) / BBB / 22,073 / 3.9% / 329 / $ (381,326) / BB / 11,036 / 1.9% / 850 / $ (176,576) / $ 572,969 / 100% / Unhedged Loss / $ (1,806,076) / Market spread represents BSABS 07-HE2 Group 2, issued February 2007 / 25
Visuals: Table with 6 columns and rows as follows. Column headers: Ratings Class; Issuance Size (000s); % of Capital Structure; Market Spread (in bps); 6bps wider in AAA & AA; 50bps wider in A / BBB / BB. Rows: AAA, $ 432,783, 75.5%, 11, $ (484,048); AA, 75,163, 13.1%, 27, $ (177,370); A, 31,914, 5.6%, 44, $ (586,755); BBB, 22,073, 3.9%, 329, $ (381,326); BB, 11,036, 1.9%, 850, $ (176,576). Total row: $ 572,969, 100%, with Unhedged Loss label in the Market Spread column and $ (1,806,076) in the last column. A single thick black rule sits under the header row across the table width. Single underline under the Issuance column sum and a single underline under the % column above the total, double underlines below the total values. The Unhedged Loss cell is highlighted with a bright yellow fill covering the label and value. No chart.
Slide 26
BEAR STEARNS / Cost of Spread Widening—Hedged with ABX 07-1 / 6bps wider in / AAA & AA / 50bps wider in / A / BBB / BB / Ratings / Class / Market / Price / 2/1/07 / Market / Spread / 2/1/07 / Market / Spread / 3/27/07 / Hedge / Ratio / Notional of / Hedge / (000s) / A / 98.68 / 96 / 245 / 0.21 / $ 6,542 / $ 397,370 / BBB / 94.13 / 375 / 833 / 0.25 / 5,518 / 984,049 / BBB- / 90.85 / 644 / 1233 / 0.21 / 2,344 / 494,803 / $ 14,405 / Cost of Hedge / (70,146) / Hedged Profit / $ 1,806,076 / Unhedged Loss / $ (1,806,076) / 26
Visuals: Table: columns Ratings Class (A, BBB, BBB-), Market Price 2/1/07 (98.68, 94.13, 90.85), Market Spread 2/1/07 (96, 375, 644), Market Spread 3/27/07 (245, 833, 1233), Hedge Ratio (0.21, 0.25, 0.21), Notional of Hedge (000s) ($ 6,542; 5,518; 2,344; total $ 14,405), and a right block headed 6bps wider in AAA & AA / 50bps wider in A / BBB / BB with values $ 397,370 (A), 984,049 (BBB), 494,803 (BBB-). Below the right block: Cost of Hedge (70,146); Hedged Profit $ 1,806,076 highlighted by a yellow fill with double underline; Unhedged Loss $ (1,806,076). No chart. Logo: Bear Stearns wordmark in black sans-serif capitals, two lines, on white. Thick black rules under table headers, a thin black rule under the logo band, a red bar.
Download this deck
The hosted PDF of every library deck is free for readers of the SlideDeck Co newsletter. Join with your email and the viewer and download appear here.
Preparing a results presentation or business update of your own? The SlideDeck Co Standard Deck is a slide library for business reviews, updates and plans.







