
The deck is Anup Kothari's segment presentation for the BASF Capital Markets Day in September 2024, covering the Industrial Solutions business. It opens with a title slide, then a cautionary note on forward-looking statements. The core content follows: the segment's role in the BASF portfolio and its 2023 sales of €8.0 billion, a review of 2019 to 2023 earnings and ROCE, and a summary of the portfolio moves and the targeted EBITDA bsi increase. The middle sections are organized around four strategic priorities for 2024 to 2028: growing with leading market positions, accelerating growth in electronic materials, driving cost efficiencies, and leveraging investments for capital efficiency. Each priority is illustrated with market share tables, growth rate estimates, customer examples such as the HyCon construction additives and the EnviNOx catalyst partnership, and a semiconductor footprint map. The deck closes with a summary slide restating the targeted increase of €400 million to €500 million by 2028. Slides 4, 7, 10 and 13 are worth studying for their chart and table construction.
Slides worth studying
Questions about this deck
What sales did BASF's Industrial Solutions segment report in 2023 according to its Capital Markets Day deck?
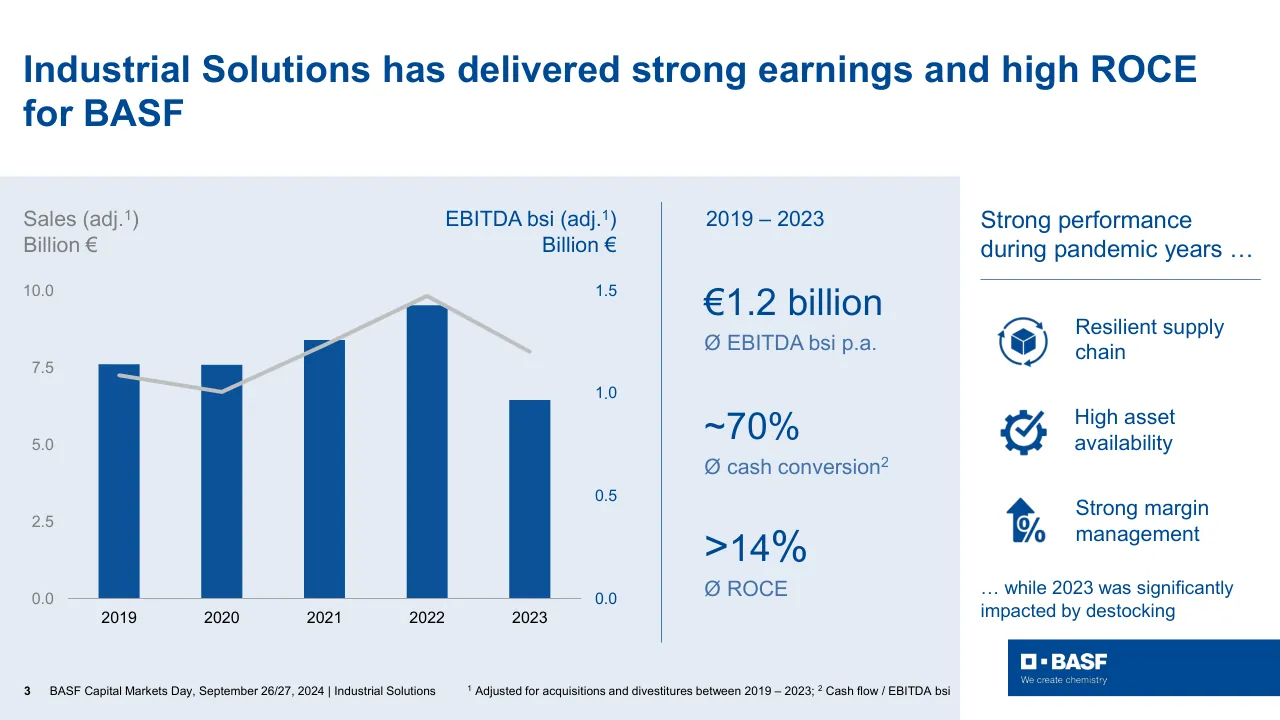
Slide 3 states that Industrial Solutions had €8.0 billion in sales in 2023. The same slide describes the segment's role in the BASF portfolio, with resilient earnings and low capital intensity.
What targeted EBITDA bsi increase does BASF's Industrial Solutions deck give for 2028?
Slide 5 gives a targeted EBITDA bsi increase of €400 million – €500 million by 2028. Slide 17 repeats this target in its closing summary.
How many slides does the BASF Industrial Solutions Capital Markets Day presentation have?
The BASF Industrial Solutions presentation has 18 pages. Slide 2 is a cautionary note on forward-looking statements, and slide 6 sets out the strategic priorities for 2024 to 2028.
What are BASF's four strategic priorities for 2024 to 2028 in the Industrial Solutions deck?
Slide 6 lists the four priorities as growing with leading market positions, accelerating growth in electronic materials, driving cost efficiencies, and leveraging investments to drive capital efficiency. Slides 7 to 16 illustrate these priorities with market share tables, customer examples, and a semiconductor market chart.
Details
Review score: 7 out of 10, Effective
Presentation quality, judged with the SlideDeck Co review heuristic. Ask, evidence and idea merit are not rated here.
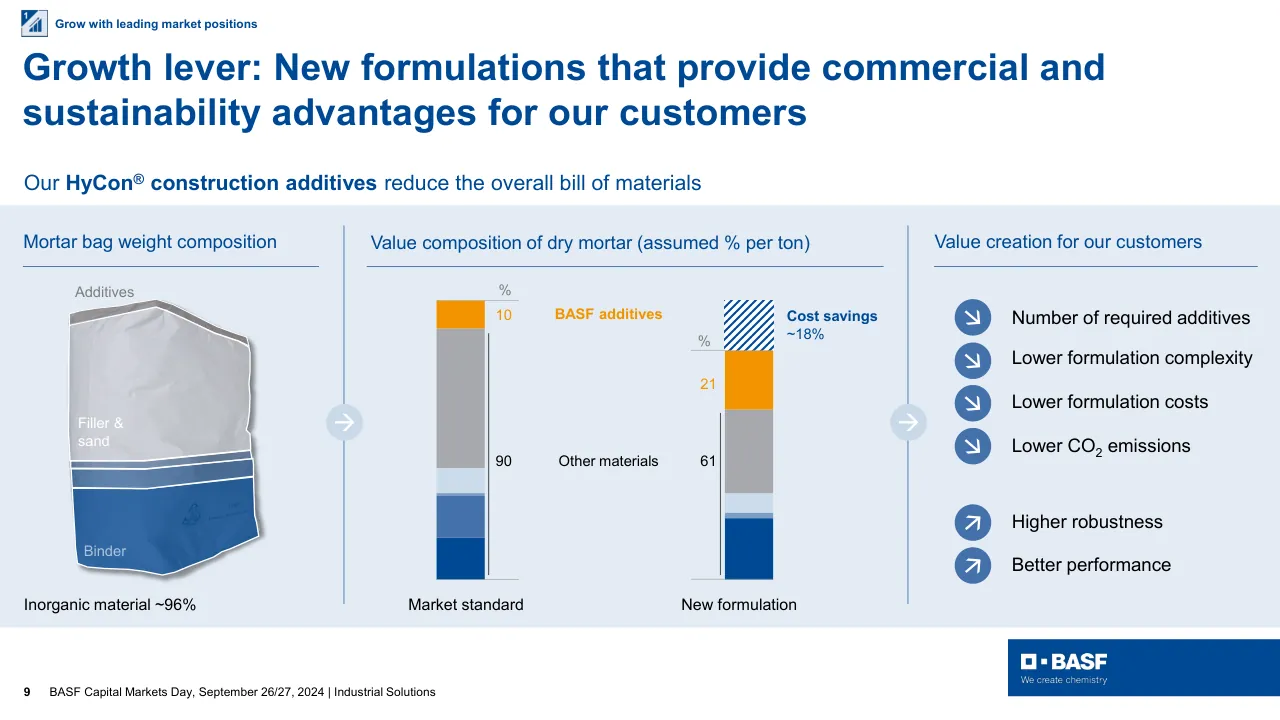
The deck has a clear route: segment overview on slides 3 to 5, four numbered priorities on slide 6 that return as section tags and a closing recap on slide 17, and a single quantified target repeated at the end. Execution is consistent and legible in the slides read at size, with action titles, a stable template, strong photography, and well built tables and charts on slides 4, 7 and 10. The weaknesses are real, though: slide 4 plots sales bars against an EBITDA line on two axes with no direct labels, the slide 10 mortar chart has unexplained segments and a confusing 90/61 bracket, and small gray labels and footnotes, dense text on slide 14 and thin content on slide 15 would strain a room. The deck also carries little narrative beyond the section structure, so it reads as a competent investor reference more than a persuasive talk.
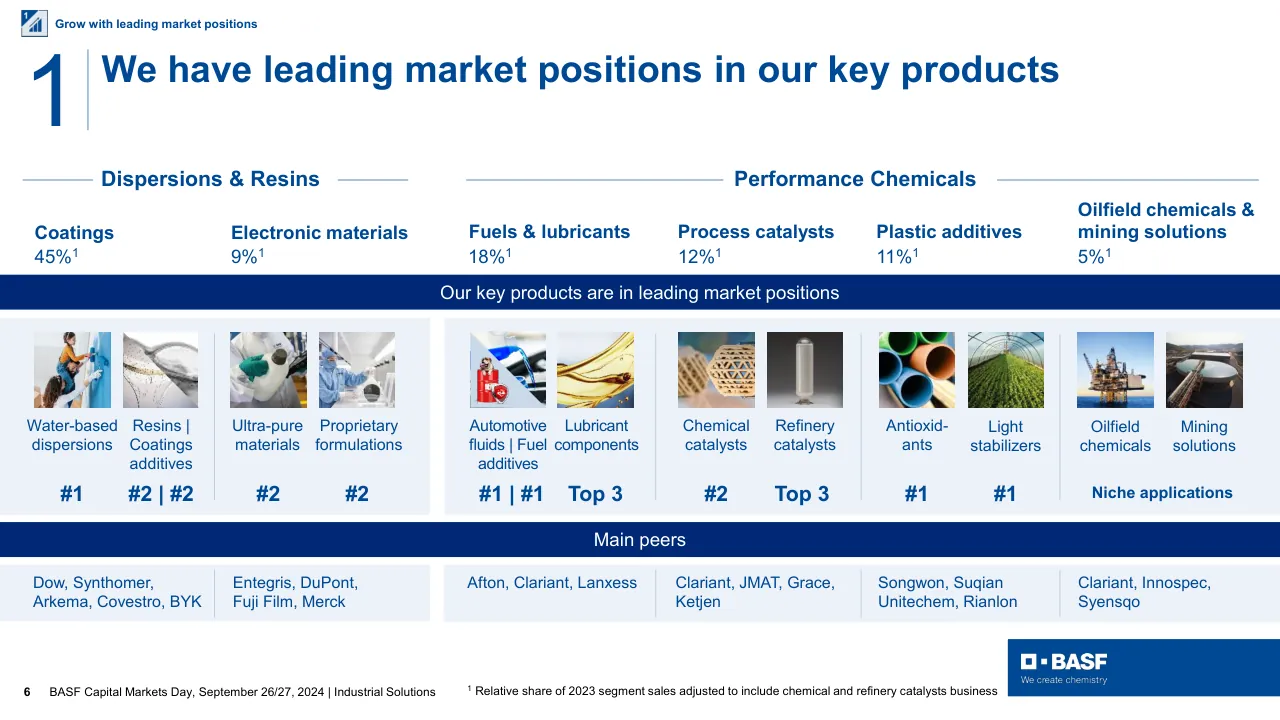
Worth keeping: Keep the numbered four-priority spine with section tags, the action-style titles, the consistent template and the market position table on slide 7.
Most useful repair: Label the slide 4 chart series directly and simplify the dual axes, and clarify the slide 10 mortar stacks with a legend or labeled segments and a clear bracket.
What would change the score: I would enlarge the small body text and footnotes on slides 8, 11, 14 and 15, trim the dense captions on slide 14, and strengthen slide 15 with a clearer visual or a stated outcome.
Confidence medium. 18 of 18 pages inspected on contact sheets, 4 at readable size. Reviewed 2026-11-08. Model-assisted review (claude-sonnet-5-5).
Full text of the slides (18 slides)
Every slide's words and a description of its charts and images, so the deck can be searched and rebuilt. Also available as Markdown.
Slide 1
BASF / We create chemistry
DRAFT: September 13, 2024
Industrial Solutions
Anup Kothari
Member of the Board of Executive Directors
BASF Capital Markets Day, September 2024
Visuals: Photograph full-bleed: a gloved hand in white nitrile gloves holds a glass or metal dish with several dark blue liquid droplets resting on a blue-tinted reflective surface; the background is a blurred light-blue lab coat and clean-room setting. Shallow depth of field. Light is soft and diffuse from the upper left, with blue dominant and touches of grey and white. Overlaid on the upper-left of the photo are curved multicoloured flowing lines (bands of dark blue, orange, green and red with fine striped edges) sweeping from the left edge across the top, passing behind the blue header band. Logo: BASF logo (white square-outline mark with a dot and the word BASF in white bold capitals) above the white tagline 'We create chemistry', on the blue band. No charts, tables or other icons.
Slide 2
Cautionary note regarding / forward-looking statements / This presentation contains forward-looking statements. These statements are based on current / estimates and projections of the Board of Executive Directors and currently available information. / Forward-looking statements are not guarantees of the future developments and results outlined / therein. These are dependent on a number of factors; they involve various risks and uncertainties; and / they are based on assumptions that may not prove to be accurate. Such risk factors include those / discussed in Opportunities and Risks on pages 173 to 183 of the BASF Report 2023. BASF does not / assume any obligation to update the forward-looking statements contained in this presentation above / and beyond the legal requirements. / 1 / BASF Capital Markets Day, September 26/27, 2024 | Industrial Solutions / We create chemistry
Visuals: One logo: the BASF logo (white square-with-dot mark, white BASF wordmark and white tagline 'We create chemistry') placed on a solid blue #004A96 rectangle in the bottom-right corner. No photographs, charts or diagrams.
Slide 3
Industrial Solutions
Driving product performance for diversified end markets
€8.0 billion sales in 2023 (share of main industries in %)
Paints & coatings
Construction
Electronic materials
Chemicals
Plastics & rubber
Paper coatings
Automotive
17%
12%
10%
9%
8%
7%
6%
We create value through customer proximity, deep application expertise and a broad product portfolio, strongly integrated into the BASF Verbund
Role in BASF portfolio
Resilient earnings and strong cash conversion with low capital intensity and high ROCE
BASF
We create chemistry
2
BASF Capital Markets Day, September 26/27, 2024 | Industrial Solutions
Visuals: Banner: full-bleed photographic header image (1479 by 211 pixels) across the top 25.4% of the slide showing blurred blue, grey and white industrial equipment with sweeping streaks in dark blue, orange, green and red across the top and right, fading to dark green-blue at lower right behind the white title; the title and subtitle are set over it with no separate tint box. Seven square photographs in a row, each boxed with square crop at 12.4% width and 22.0% height: (1) Paints & coatings: dense pile of open paint cans with lids off in yellow, white, pink, green, blue, orange and red paint on a dark background, the top white-and-blue can sharp in the centre. (2) Construction: a worker in a dark sleeved jacket and blue-grey gloves smoothing white plaster on a white wall with a trowel, cropped at the left edge, mostly white and grey tones. (3) Electronic materials: a printed circuit board with glowing blue traces, a chip and binary digits (0 and 1) on a dark navy background, lit in saturated blue. (4) Chemicals: an industrial plant of grey and white pipes, tanks and towers with yellow railings and a small worker in blue overalls at the lower centre, overcast grey light. (5) Plastics & rubber: two hands cupping white plastic pellets (granules) against a white background, cropped at the top and bottom. (6) Paper coatings: a grey-haired man in blue workwear looking at a long white roll of material in a grey machine room with metal railings, cool neutral light. (7) Automotive: close-up of a metallic orange-copper car side mirror and door panel with warm light and soft background blur. Percentages in blue numerals: 17%, 12%, 10%, 9%, 8%, 7%, 6%, one under each photo. BASF logo: white square-with-dot mark and white BASF wordmark on the blue box, with the tagline We create chemistry in small white type beneath it. No other icons.
Slide 4
Industrial Solutions has delivered strong earnings and high ROCE
for BASF
Strong performance
during pandemic years …
Sales (adj.1)
Billion €
EBITDA bsi (adj.1)
Billion €
2019 – 2023
€1.2 billion
Ø EBITDA bsi p.a.
~70%
Ø cash conversion2
>14%
Ø ROCE
Resilient supply
chain
High asset
availability
Strong margin
management
… while 2023 was significantly
impacted by destocking
10.0
7.5
5.0
2.5
0.0
1.5
1.0
0.5
0.0
2019
2020
2021
2022
2023
3
BASF Capital Markets Day, September 26/27, 2024 | Industrial Solutions
1 Adjusted for acquisitions and divestitures between 2019 – 2023; 2 Cash flow / EBITDA bsi
BASF
We create chemistry
Visuals: Chart: combined bar and line chart. Bars are Sales (adj.) in Billion € on a left axis from 0.0 to 10.0 with ticks at 0.0, 2.5, 5.0, 7.5 and 10.0, bars in solid #004A96 blue for 2019 (about 7.6), 2020 (about 7.6), 2021 (about 8.4), 2022 (about 9.5) and 2023 (about 6.5); no bar values are printed. Line is EBITDA bsi (adj.) in Billion € on a right axis from 0.0 to 1.5 with ticks at 0.0, 0.5, 1.0 and 1.5, drawn as a light grey #BFBFBF line about 4 px thick with markers absent, with estimated values 2019 about 1.1, 2020 about 1.0, 2021 about 1.25, 2022 about 1.4 (the peak) and 2023 about 1.2; no line values are printed. No legend; axis titles are placed above each axis in the same colour as their series. Years 2019 to 2023 are printed below the bars in black. Right side: three large stat figures with captions and a vertical divider line. Icons: three line-style solid icons in #004A96, each about 4.4 by 7.8 percent of the slide: top is a cube inside two circular arrows (Resilient supply chain), middle is a gear with a checkmark (High asset availability), bottom is an upward arrow with a percent sign (Strong margin management). BASF logo: white square mark, white bold BASF wordmark and white tagline We create chemistry on a #004A96 box.
Slide 5
We have built a strong, focused portfolio and are well positioned to
accelerate value creation
Our diligent efforts in 2019 – 2023 …
… will allow us to accelerate value
creation in 2024 – 2028
Portfolio moves
Paper & water
Pigments
Kaolin minerals
Flocculants for mining
+
+40%
Invested prudently in growth markets
Improved asset performance and supply chain resilience
Optimized continuously to drive cost efficiencies
2023
2028
Targeted EBITDA bsi increase of
€400 million – €500 million by 2028 1
… and attapulgite-based products
1 EBITDA bsi incl. chemical and refinery catalysts business to be transferred to Performance Chemicals as of January 1, 2025
4 BASF Capital Markets Day, September 26/27, 2024 | Industrial Solutions
We create chemistry
Visuals: Four photographs in a 2x2 grid on the left, each with a dark navy label bar at its bottom. Top-left: a brick office building with BASF signage, two blue and yellow flags and a glass entrance, under a clear sky, bright daylight, warm orange-brown dominant colours, full frame. Top-right: a man in a dark blazer and glasses smiling beside a white board reading COLORS & EFFECTS in black capitals with a colourful hexagon logo, indoor lighting, navy and white dominant colours. Bottom-left: an aerial view of a kaolin mine with a turquoise pit lake surrounded by pale sand and green forest, daylight, green and turquoise dominant colours. Bottom-right: two workers in blue overalls and white hard hats looking at a tablet beside industrial pipework, daylight, blue and white dominant colours. All photos are boxed, square-cornered, not cropped to shape. A vertical thin navy divider line with a light blue circle containing a navy plus sign sits between the photo grid and the bullets. A light blue pentagonal band (arrow shape pointing right) sits behind the bullets and chevron lines. Two thin navy chevron outlines point right beyond the band. The chart is a two-bar column chart with no title, no y-axis, no values printed, no legend: a grey bar labelled 2023 (about 50% of the 2028 height) and a dark blue bar labelled 2028 (full height), on a thin grey baseline. A curved dark blue arrow rises from the top of the 2023 bar to the top of the 2028 bar, labelled +40% in bold navy. Bottom-right BASF logo: white square-with-dot mark and white BASF wordmark with tagline We create chemistry on a solid blue rectangle.
Slide 6
Our strategic priorities for 2024 – 2028 will drive value creation / for BASF Group / 1 / Grow with leading / market positions / Value creation share¹ / 2 / Accelerate growth in / electronic materials / Value creation share¹ / 3 / Drive cost efficiencies / Value creation share¹ / 4 / Leverage investments, / drive capital efficiency / Capex at ~80% of / depreciation from / 2024 – 2028 / 5 BASF Capital Markets Day, September 26/27, 2024 | Industrial Solutions 1 Share of additional EBITDA excl. inflation & other negative effects / We create chemistry
Visuals: Background photograph: blurred laboratory scene of glass flasks and vessels with a blue-tinted tone, grey-white gloved hands at lower left, pale blue light at top, full-bleed covering the entire slide. Decorative swoosh: a set of flowing stripes entering from the left at about 25 to 45% height and rising to the right at about 20 to 31% height, made of a dark blue band (#004A96), an orange band (#F5A000), a green band (#7AB82D) and a red band (#C8102E), with fine multi-line hatching in the same colours fading toward the left. Icon 1 (card 1): an ascending bar chart with three bars of increasing height and an upward arrow, in pale blue-grey #9FB3CE. Icon 2 (card 2): a computer chip with circuit pins on all four sides, in #9FB3CE. Icon 3 (card 3): a hand palm-up holding a coin with a euro sign, in #9FB3CE. Icon 4 (card 4): a gear with a euro sign inside, in #9FB3CE. Donut chart 1 (card 1, title Value creation share with superscript 1): two halves, right half dark blue #004A96 representing about 50 percent and left half light grey-blue #C3CFE1, ring thickness about half the outer diameter, no labels or legend. Donut chart 2 (card 2): about 80 percent light grey #C3CFE1 and about 20 percent dark blue #004A96 occupying the lower-left arc between about 7 and 6 o'clock, no labels or legend. Donut chart 3 (card 3): about 35 percent dark blue #004A96 occupying the arc from 12 o'clock counter-clockwise to about 8 o'clock, the remainder light grey #C3CFE1, no labels or legend. Card 4 has no donut; it carries the text Capex at ~80% of depreciation from 2024 – 2028 in its lower half. Logo: BASF wordmark in white with a white square-with-dash mark and white tagline We create chemistry, on a #004A96 box.
Slide 7
Grow with leading market positions / 1 / We have leading market positions in our key products / Dispersions & Resins / Performance Chemicals / Coatings / 45%¹ / Electronic materials / 9%¹ / Fuels & lubricants / 18%¹ / Process catalysts / 12%¹ / Plastic additives / 11%¹ / Oilfield chemicals & / mining solutions / 5%¹ / Our key products are in leading market positions / Water-based / dispersions / Resins | / Coatings / additives / Ultra-pure / materials / Proprietary / formulations / Automotive / fluids | Fuel / additives / Lubricant / components / Chemical / catalysts / Refinery / catalysts / Antioxid- / ants / Light / stabilizers / Oilfield / chemicals / Mining / solutions / #1 / #2 | #2 / #2 / #2 / #1 | #1 / Top 3 / #2 / Top 3 / #1 / #1 / Niche applications / Main peers / Dow, Synthomer, / Arkema, Covestro, BYK / Entegris, DuPont, / Fuji Film, Merck / Afton, Clariant, Lanxess / Clariant, JMAT, Grace, / Ketjen / Songwon, Suqian / Unitechem, Rianlon / Clariant, Innospec, / Syensqo / 6 / BASF Capital Markets Day, September 26/27, 2024 | Industrial Solutions / 1 / Relative share of 2023 segment sales adjusted to include chemical and refinery catalysts business / BASF / We create chemistry
Visuals: Photographs, 12 tiles in two groups, each 118 by 118 px image shown about 5.9% by 10.5% of the slide, square and not cropped to a circle. Left group, left to right: (1) Water-based dispersions: a person in a yellow-and-orange top and dark trousers rolling or painting a bright blue wall, a second person at bottom left, bright daylight, blue dominant with warm yellow accent. (2) Resins | Coatings additives: a grayscale macro of swirling dark and white coating texture, high contrast, with a diagonal crop. (3) Ultra-pure materials: a gloved hand in teal-green nitrile glove pouring or handling a white plastic container in a clean-room setting, white and grey dominant. (4) Proprietary formulations: a technician in a blue cleanroom suit and mask working at a lab bench with glassware, cool grey-blue lighting. Right group: (5) Automotive fluids | Fuel additives: a glass flask of bright blue liquid with a splash, next to a small red fuel-can icon with a shield symbol overlaid on the lower-left diagonal of the photo; the photo is partly tinted blue. A small image of 72 by 88 px at about 3.5% by 7.4% overlays it. (6) Lubricant components: close-up of amber golden oil flowing in a glossy swirl, warm golden tones with blue-grey background at right. (7) Chemical catalysts: a honeycomb-patterned ceramic catalyst monolith in beige, lit from the front on grey. (8) Refinery catalysts: a tall grey cylindrical reactor vessel on a stand against a dark grey gradient background. (9) Antioxid-ants: a stack of green, blue and orange plastic pipes seen end-on, bright saturated colours. (10) Light stabilizers: a greenhouse structure above rows of green crops in a field, diagonal perspective, green dominant. (11) Oilfield chemicals: an offshore oil platform on blue sea under a pale sky, warm lit structure. (12) Mining solutions: an aerial view of a large round mining tank or pond with a conveyor, grey-brown and blue. Each photo is a boxed tile with no border and no overlay. A small 58 by 59 px image sits at the position of the Resins image, duplicating its area. Logo: BASF blue box at bottom right with white BASF wordmark and square-dot mark and tagline 'We create chemistry'. Icon: top-left square icon, about 2.2% by 3.9%, showing a white bar chart with an upward arrow on a blue square with the number 1 at top-left, framed by a thin blue outline. Lines: thin horizontal rules flanking the section headers, in mid blue; a thin vertical grey-blue rule beside the large numeral and vertical dividers between tile groups within the panels. Rank labels are text, not charts.
Slide 8
Grow with leading market positions
Key trends drive growing need for fit-for-purpose products
Dispersions & Resins
Performance Chemicals
Coatings
Electronic materials
Fuels & lubricants
Process catalysts
Plastic additives
Oilfield chemicals &
mining solutions
~3%
~5%
~1.5%
~3%
~3%
~2%
Regulation
Low-emission
High-speed innovation
Regionalization
Fuel economy
Electrification
CO₂ reduction
Renewable feedstock
Product durability
Recycled plastic
Resource efficiency
Water management
BASF
We create chemistry
7
BASF Capital Markets Day, September 26/27, 2024 | Industrial Solutions
Annualized market growth rate 2024 – 2028
Visuals: Six rectangular photographs in a row, each 14.6% wide and about 37% tall, placed directly above grey percentage boxes: (1) Coatings: a red-handled paintbrush with a silver ferrule stamped '50' and white bristles resting diagonally on a pale raw wooden plank, warm natural light, cream and red dominant, sharp-cornered box, slight crop at edges. (2) Electronic materials: close-up of a dark navy circuit board chip with glowing blue traces, copper-gold circuit lines and white and blue binary digits (0 and 1) overlaid, diagonal composition, cool blue lighting, full box. (3) Fuels & lubricants: a silver-grey electric SUV front and side view with dark grille, small orange badge, thin white light strip on headlights and a black wheel at right edge, set against a pale beige and blue desert sky, lit by soft warm daylight, cropped at right and bottom. (4) Process catalysts: a petrochemical plant with tall grey columns, pipes, tanks and lit structures at dusk under a pale blue-lavender sky, with glowing light-blue wavy lines swirling across the upper half, cool palette. (5) Plastic additives: interior of a greenhouse with an arched steel and glass frame and rows of bright green lettuce plants filling the foreground, bright daylight, saturated green and white. (6) Oilfield chemicals & mining solutions: aerial view of a mining and water treatment site with brown rocky hillsides, turquoise circular basins with white foam, grey pipes and walkways, blue sky with white clouds at top, bright daylight. Percentage boxes: light grey rectangles with black centred Arial text. Small icon top-left: a blue-outlined square containing a white box with dark blue bars rising to the right and a small number 1. Two thin dark blue horizontal rules under the section headings. Legend swatch: small light grey square before the legend text. BASF logo: white square-with-bar emblem and white bold BASF wordmark with white tagline We create chemistry, on a blue panel.
Slide 9
Grow with leading market positions / Our business model enables us to win and grow with our customers / We enable our customers / to win … / ... by applying our strengths to their advantage / Products / Customer proximity / Know-how / Value creation through / Performance / Sustainability / Cost competitiveness / Chemistry toolbox to enable and enhance products / Profitable outlet for C3 & C4 value chains / Regional asset and R&D footprint / Decade-long customer relationships / >800 technical experts with 15 years average tenure / Local customer support for swift problem solving / 8 / BASF Capital Markets Day, September 26/27, 2024 | Industrial Solutions / We create chemistry
Visuals: Icon: small blue and white square icon at top left showing a bar chart with an upward arrow and the number 1, about 2.2% by 3.9% of the slide. Diamond icon: a white outlined diamond gem in the navy left column, centred around x 13%, y 49%, spanning about 7.4% to 19% width and 41% to 56.5% height, drawn as a white stroke outline with interior facet lines (one horizontal girdle line and three converging facet lines to the culet) and no fill; measured fill #EDF2F8 is its light fill colour. Photograph 1 (Products): full-colour photo, boxed, not cropped, at about 29.8% x 42.4% y, 18.9% wide and 25.1% high, showing two workers in light blue cleanroom coveralls with hoods, face masks and safety goggles, holding up a curved silicon wafer-like disc with both gloved hands; a BASF logo is printed on the suit, the setting is an indoor clean environment with bright even lighting; dominant colours are light blue, white and teal-blue; no overlay. Logo panel (Customer proximity): a pale grey-blue rectangle #DCE5F0 at about 53.9% x 42.4% y, 18.8% wide and 25.2% high holding six logos in a 2 by 3 arrangement with the first row having two logos and rows two and three arranged as listed: row 1 tsmc red wordmark above a black and white wafer-pattern mark with a red underline at about 54.3% x 43.7% y (6.7% by 7.4%), and CBMM blue wordmark with a blue chevron mark at about 62.7% x 45.8% y (7.5% by 2.5%); row 2 EASTMAN black wordmark at about 55.0% x 53.6% y (10.5% by 2.1%), and PPG white letters on a blue rounded square at about 67.1% x 51.5% y (4.3% by 5.9%); row 3 Sika red triangle with the word Sika and a registered mark at about 55.1% x 58.2% y (5.0% by 7.6%), and Infineum blue wordmark with a blue swoosh at about 62.0% x 59.4% y (10.9% by 6.9%). Photograph 2 (Know-how): full-colour photo, boxed, not cropped, at about 77.9% x 42.4% y, 18.9% wide and 25.0% high, showing two workers in navy blue coveralls and blue hard hats standing on a yellow-railed platform looking up at pipework, with a large white cylindrical storage tank and steel structures behind; daylight, dominant colours are blue, white, yellow and grey; no overlay. Arrow icon: a light blue-grey circle about 25.4% to 28.2% x and 53.6% to 58.7% y with a navy left-pointing arrow glyph centred in it, sitting over the boundary of the navy and pale blue zones. Plus icons: two light blue-grey circles at about 49.8% to 52.7% x and 52.9% to 57.9% y, and 74% to 76.9% x and the same height, each containing a navy plus sign. Lines: a thin white horizontal rule at about 34.1% y spanning 1.7% to 24.3% x in the navy column under the first statement; a thin navy horizontal rule at about 34.1% y across the right column from 29.8% to 96.9% x; two thin navy vertical dividers at about 51.2% x and 75.4% x running from 42.4% to 85.3% y. Bullet markers: small orange squares. Logo: BASF logo with a white square-and-dash mark and bold white wordmark BASF with the tagline We create chemistry below, on the navy-blue block at bottom right.
Slide 10
Grow with leading market positions
Growth lever: New formulations that provide commercial and sustainability advantages for our customers
Our HyCon® construction additives reduce the overall bill of materials
Mortar bag weight composition
Value composition of dry mortar (assumed % per ton)
Value creation for our customers
Additives
Filler & sand
Binder
Inorganic material ~96%
%
10
BASF additives
%
21
Cost savings
~18%
90
61
Other materials
Market standard
New formulation
Number of required additives
Lower formulation complexity
Lower formulation costs
Lower CO₂ emissions
Higher robustness
Better performance
9
BASF Capital Markets Day, September 26/27, 2024 | Industrial Solutions
BASF
We create chemistry
Visuals: Left: photograph-style illustration of a grey-white paper mortar bag, slightly crumpled, with a white outline and soft drop shadow, shown in three tinted zones: the top grey band labelled Additives, a large grey-white middle section labelled Filler & sand, and a dark-blue bottom section labelled Binder with a small faint BASF logo. The bag is shown full-colour, not cropped, centred in its column. Middle: two stacked vertical bar charts titled Value composition of dry mortar (assumed % per ton), with a percent label above each bar. Market standard bar (left): from bottom dark blue #004A96 segment, mid blue #7CA0C6 segment, pale blue #CCDBEA segment, grey #817F7F at 60% opacity segment labelled 90 with a black bracket line, and an orange #F39500 top segment labelled 10 with BASF additives in orange text. Values are printed on the chart; segment heights are about 10 and 90 units. New formulation bar (right): from bottom dark blue segment about 19 units, mid blue thin segment about 1 unit, pale blue segment about 4 units, grey segment labelled 61 with a black bracket line, orange segment labelled 21, and a top hatched segment in dark blue diagonal stripes labelled Cost savings ~18%. Baseline axis lines in grey under both bars. No legend; the orange and hatched segments are the highlighted points. Right: a vertical list of six items, each with a circular badge: four with down-right arrows (Number of required additives, Lower formulation complexity, Lower formulation costs, Lower CO₂ emissions) and two with up-right arrows (Higher robustness, Better performance), with a gap between the fourth and fifth items. Bottom-right: BASF logo wordmark in white with tagline We create chemistry on a dark-blue box.
Slide 11
Grow with leading market positions
Growth lever: Product solutions for electrified powertrains based on our strong application expertise
Growth example: Coolants for BEV1
Coolants first fill market
CAGR
+5%
2019
2030
BEV require ~2x as much coolants than vehicles with an internal combustion engine
BASF’s GLYSANTIN® G22® ELECTRIFIED® offers a safety-optimized solution for BEV
Electric powertrain
HVAC housing
Long-term thermal stabilizers
Electric motor
Components for lubricants
Coolants (GLYSANTIN®)
Driveline
Axle and transmission lubricants
Components for lubricants
Brake system
Brake fluids
Interior & Exterior
Instrument panel
Light stabilizers
Car body panels
Process stabilizers
Battery pack
Battery cells
Licity® anode binder
Thermal management & power supply
Coolants (GLYSANTIN®)
BASF
We create chemistry
10 BASF Capital Markets Day, September 26/27, 2024 | Industrial Solutions
1 Battery electric vehicles
Visuals: Chart: simple two-bar column chart titled 'Coolants first fill market' with category axis labels 2019 (left) and 2030 (right); no value axis, no numeric values printed, so bar heights are about: 2019 bar about 40% of plot height, 2030 bar about 75% of plot height, both in #004A96 (single series, no legend). A thin baseline (grey) runs under both bars. Overlaid is a CAGR annotation: an orange (#F39200) open circular arc, about 60% around, centred between the bars, with blue (#004A96) connector arrows from the 2019 bar top to the arc and from the arc to the top of the 2030 bar (arrowhead on the 2030 side); the arc reads 'CAGR' (bold, #004A96) over '+5%' (bold, #004A96). Photograph: a grey-white semi-transparent 3D rendering of a battery-electric SUV seen from front-left above, body rendered as pale translucent grey cut-away showing internals; the battery pack is a flat light-grey box across the floor, with yellow coolant hoses and a silver e-motor/drive unit above it, a front black electric component at the front-left, and a separate blue-and-black battery module standing upright at the right. Lighting is soft studio, with a light grey gradient floor shadow beneath. Framing: full car, slightly cropped at the bottom-left wheel, no border. Three overlapping translucent blue (#4A7FC1 approx, about 50% opacity) circles sit over the battery pack as a Venn-like highlight. Thin blue (#004A96) leader lines (about 1 pt) run from the 'Electric powertrain' heading down to the battery area, from 'Interior & Exterior' down to the e-motor, and from 'Battery pack' leftwards to the battery. Icon: small blue-and-white square chart icon with bars and an upward arrow at top-left.
Slide 12
Grow with leading market positions / Growth lever: Enabling the green transformation by developing / and supplying novel high-performance catalysts / High-performance catalysts for thyssenkrupp Uhde’s leading EnviNOx® technology to reduce greenhouse gas emissions / ~700,000 / tons of nitrogen oxides generated by / nitric acid production per year / 265x / stronger global warming potential of N2O1 compared with CO2 / >99% / reduction of N2O and NOx emissions / through EnviNOx® / From 2019 – 2023, >20 plants were equipped with industrial-scale EnviNOx® units worldwide using our catalyst, resulting in emission abatement of / >7 million tons CO2 equivalents in 2023 / This partnership brings additional benefits for our customers, as well as to the environment as a whole, by providing high-quality, cost-effective solutions to address complex environmental challenges. / – Dr. Ralph Kleinschmidt / Head of Technology & Innovation at thyssenkrupp Uhde / 11 / BASF Capital Markets Day, September 26/27, 2024 | Industrial Solutions / 1 GWP factor according to IPCC 5th assessment report / We create chemistry
Visuals: Photograph (left, bleeding off left and bottom edges, 0 to 25.8 percent width, 31.4 to 100 percent height, cropped to a tall vertical strip): close-up of an industrial stainless-steel vessel or duct, a large curved silver hood narrowing downward into a pipe, with a metal handrail and bolted flanges at the lower left and a white-grey steel structure at the top right. Lighting is cool, diffuse daylight with specular highlights on the polished metal. Dominant colours are steel blue-grey (about #7F9DBA) and silver-white (about #C9D4DE). No overlay or tint. Icon (top left, 1.5 percent x, 1.1 percent y, 2.2 by 3.9 percent): square icon with a blue #004A96 frame containing white rising bar chart bars and an upward arrow, with a small number 1. Quote mark graphic (behind the quote, 70.9 percent x, 29.5 percent y, 19.3 by 25.6 percent, 700 by 524 pixels): two large pale grey-blue opening quotation marks (about #E3E9F1) on white, partly behind the quote text. Divider (horizontal line at 68.4 percent y, from about 28.0 to 68.4 percent x): thin 1 px line in blue #3A6EA5 with a circular break at its centre. Circle (centred at about 48.3 percent x, 68.4 percent y, about 2.8 by 5.0 percent): light blue-grey filled circle (about #C5D6EA) with a thin white downward arrow (Wingdings arrow glyph) in its centre. Logo (bottom right, 79.8 percent x, 90.8 percent y, 6.6 by 4.3 percent): BASF logo, white wordmark with a small white square-and-dot mark, on the blue block. Statistics: three right-aligned large blue figures and three black descriptions as listed in the text.
Slide 13
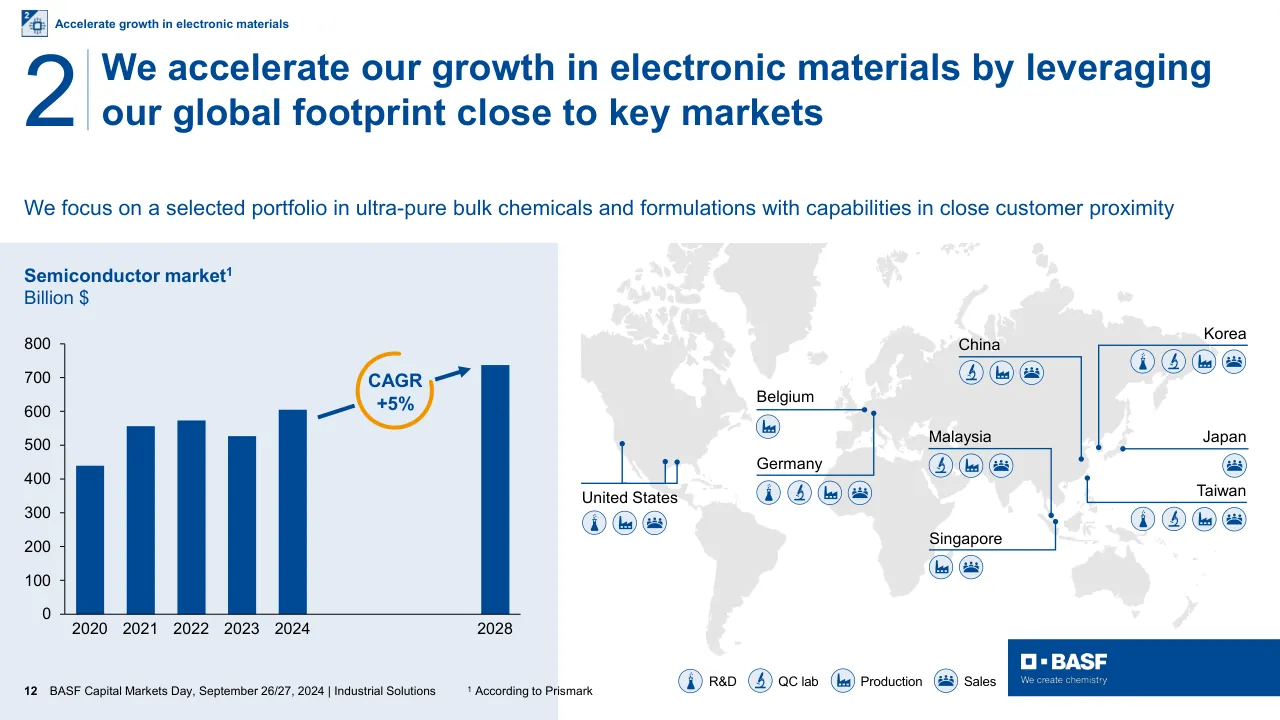
2 / Accelerate growth in electronic materials / We accelerate our growth in electronic materials by leveraging our global footprint close to key markets / We focus on a selected portfolio in ultra-pure bulk chemicals and formulations with capabilities in close customer proximity / Semiconductor market 1 / Billion $ / 800 / 700 / 600 / 500 / 400 / 300 / 200 / 100 / 0 / 2020 2021 2022 2023 2024 / CAGR / +5% / 2028 / Korea / China / Japan / Belgium / Germany / Taiwan / Malaysia / United States / Singapore / R&D QC lab Production Sales / We create chemistry / 12 / BASF Capital Markets Day, September 26/27, 2024 | Industrial Solutions / 1 According to Prismark
Visuals: Bar chart titled Semiconductor market with superscript 1, subtitle Billion $, in the left panel. Vertical bars in solid #004A96, no gridlines, no legend, value axis labelled 0 to 800 in steps of 100 (no unit label beyond Billion $). Category axis labels 2020, 2021, 2022, 2023, 2024 and, separated by a gap, 2028. Values are not printed; estimated values: 2020 about 440, 2021 about 555, 2022 about 572, 2023 about 527, 2024 about 604, 2028 about 738. Bars are about 3.2% of slide width wide. An orange (#F39200) open circular arc surrounds the label CAGR +5% (bold #004A96) in the gap between 2024 and 2028. A dark blue (#004A96) line with arrowhead runs from just right of the 2024 bar top upward to the right, ending near the top of the 2028 bar, indicating the growth path. Right area: a grey (#E6E6E6) world map with no borders drawn, with dark blue (#004A96) leader lines and dot markers pinned to United States (two dots on west coast and southeast coast plus one on the mid-west), Belgium, Germany, China, Malaysia, Singapore, Korea, Japan and Taiwan. Each location has a row of circular icons: circles with dark blue outline and white fill containing blue pictograms. United States: R&D flask, Production factory, Sales people group. Belgium: Production factory. Germany: R&D flask, QC lab microscope, Production factory, Sales people group. China: QC lab microscope, Production factory, Sales people group. Malaysia: QC lab microscope, Production factory, Sales people group. Singapore: Production factory, Sales people group. Korea: R&D flask, QC lab microscope, Production factory, Sales people group. Japan: Sales people group. Taiwan: R&D flask, QC lab microscope, Production factory, Sales people group. Legend at bottom centre: four circular icons with labels R&D (flask), QC lab (microscope), Production (factory), Sales (people group). Logo: white BASF square-mark and BASF wordmark with tagline We create chemistry, on dark blue box. Top-left: small square icon, blue and white, showing a chip-like pictogram with number 2 in corner.
Slide 14
Accelerate growth in electronic materials / Our core capabilities differentiate and create value for our customers and for BASF / Our value proposition for our customers ensures customer retention … / … and financial success / Net sales / increase / +15% / EBITDA bsi / increase / +42% / 2019 / 2023 / Innovation / Speed / Investment execution / Customer productivity / Enabling manufacturing of new chip architectures by deep customer knowledge, access to BASF additive library, and cooperations with world leading R&D institutes (e.g., IMEC) / Accelerating advanced node semiconductor development via key account-driven R&D and sampling centers / High-speed interaction cycles with deep input and performance feedback / Continuous disciplined capacity expansions with long-term customer commitments; track record of flawless investment execution for best-in-class manufacturing / Lower cost of ownership in critical process steps in combination with increased yield and throughput improvement at customers / 2019 / 2023 / 13 / BASF Capital Markets Day, September 26/27, 2024 | Industrial Solutions
Visuals: Four photographs in a row, each about 16% wide and 33% tall, all boxed with square corners and no overlay: (1) Innovation: two people in blue cleanroom coveralls and hoods stand in a bright white cleanroom lab, one holding a tablet, with another worker and lab equipment in the background; shot from a wide angle, ceiling vents and lights visible; dominant colours light blue, white and grey. (2) Speed: a gloved hand in a blue sleeve lowers a black semiconductor wafer into a white tray of liquid inside a white process tool with a perforated white surface; close framing; dominant colours white, pale blue and black. (3) Investment execution: a stack of silicon wafers with a rainbow iridescent interference pattern in the foreground, blurred blue-suited workers and white equipment behind; shallow depth of field; dominant colours blue, purple, green and white. (4) Customer productivity: a worker in a blue cleanroom hood and goggles leans over a white wet-bench tank with water droplets, next to a white machine and a red-and-green signal tower light; dominant colours light blue, white and grey. Two bar charts, each with a grey 2019 bar and a dark blue 2023 bar on a thin grey baseline, years printed below each bar. Chart 1 (Net sales increase): 2019 bar grey #C0C0C0 about 13% of slide height tall, 2023 bar #004A96 about 20% tall; a curved dark blue arrow rising from the 2019 bar to the 2023 bar, labelled +15%. Chart 2 (EBITDA bsi increase): 2019 bar grey #C0C0C0 about 7% tall, 2023 bar #004A96 about 19% tall; curved dark blue arrow rising from the 2019 bar to the 2023 bar labelled +42%. The bars are not labelled with numeric values, only years. Logo: white BASF square-logo mark with the word BASF and the tagline We create chemistry, on a solid #004A96 box in the bottom-right corner. Icon: small blue square icon with a white microchip-like graphic at top-left next to the section label.
Slide 15
Cost efficiencies / 3 / We drive cost efficiencies to reduce the impact of inflation / Asset optimization / Digitalization / Procurement excellence / Lean organization / Operational excellence savings / Site closures & optimization / R&D / Operations / Qualify additional suppliers / Renegotiation / Restructuring / Delayering & double-hatting / 14 / BASF / Capital Markets Day, September 26/27, 2024 | Industrial Solutions
Visuals: Four photographs in a row, each a portrait rectangle with square corners. (1) Left column: a refinery operator in a blue coverall and white hard hat stands on a walkway reaching toward a pipe valve; large white pipes, orange valve handwheels and flanges fill the frame, a light fixture sits at left, and pale blue sky with clouds shows at top; daylight, cool and neutral; dominant colours white, orange and blue; full-height crop, bottom edge hidden behind the navy band. (2) Second column: a beige six-axis industrial robot arm reaches into a grey machine cabinet with cables, panels and a metal rail; cool overcast lighting; dominant colours grey, steel blue and beige; cropped, bottom hidden behind the band; a small grey square (about #808080, about 2.2 by 4.0 percent) sits at its top-right corner. (3) Third column: a red reach-stacker lifts a blue shipping container against a stack of red, blue and orange containers under an orange-yellow sunset sky; dominant colours orange, red and blue; cropped at bottom behind the band; a small grey square (about #808080) sits at its top-right corner. (4) Right column: close-up of several hands clasped together in a huddle on a wooden deck, with a translucent white network overlay of connected nodes and lines across the image; background softly blurred with bokeh; desaturated grey-blue and warm skin tones; cropped and bottom hidden behind the band. Also: a section icon at top-left (about 2.2 by 3.9 percent), a square with a thin blue border holding a white and blue pictogram of a figure with the number 3 in the corner; and the BASF logo in a navy #004A96 box at bottom-right, a white BASF wordmark with a square mark and the white tagline 'We create chemistry' below it.
Slide 16
Capital efficiency / 4 / We leverage recent investments in growth markets and drive / capital efficiencies / Location of key / investments in 2021 – 2023 / We will continue to invest at ~80% of / depreciation in 2024 – 2028 / -20% / Expansion / Optimization / Business / continuity / Depreciation / Capex / 15 / BASF Capital Markets Day, September 26/27, 2024 | Industrial Solutions / BASF / We create chemistry
Visuals: 1) Small section icon at top left (about 1.5%, 1.1%, 2.2% by 3.9%): a square blue-and-white gear icon with a small number 4, filled #004A96 and white, with a light blue corner. 2) World map, a photographic-style flat map image, placed 0% to 64.3% horizontally and 24.5% to 100% vertically, cropped at the bottom and left edges, showing Europe, Africa, Asia, Australia and South America in a pale blue-grey (about #AFC4DE) on a light blue sea (#E4EBF4). A semi-transparent light-blue overlay (#E4EBF4 at 60% opacity) covers the left-top portion of the map area (0% to 16.9% horizontally, 24.4% to 62.8% vertically), lightening the map there. 3) Location pins: dark blue (#004A96) map-pin markers with white inner circles, placed about as follows: one over central Europe (about 21% across, 39% down); one over the Black Sea region (about 26%, 42%); one over India (about 36%, 49%) with a second pin just below it (about 37%, 53%); a cluster of about three overlapping pins over southern China (about 46% to 48%, 46% to 50%); one pin over southern China or Vietnam coast (about 45%, 50%); a cluster of about three overlapping pins over the Malay peninsula or Singapore (about 43% to 44%, 56% to 59%); and one pin over Indonesia (about 44%, 60%). Some pins carry a small white icon glyph. 4) Bar chart, titled by the right heading, with no axis numbers: two vertical bars on a shared baseline (a thin black line at about 79.9% down, from about 72% to 88% across). Bar one, labelled Depreciation below: a plain grey (#C0C0C0) bar, full height reference, top at about 44.9% down, about 74.0% to 78.4% across. Bar two, labelled Capex below: a stacked bar, about 81.9% to 86.3% across, top at about 52.2% down, with three segments from top to bottom: Expansion in dark blue #004A96 (about 52.2% to 60.5% down), Optimization in mid blue #4472AA (about 60.5% to 66.0% down), and Business continuity in light blue #7CA0C6 (about 66.0% to 79.6% down). Segment labels sit to the right of the bar in matching colours. A dashed grey horizontal reference line runs from the top of the depreciation bar to above the capex bar, with a solid grey downward arrow (#808080) pointing to the top of the capex bar, labelled -20% in grey. No numeric values, scale or legend are printed. Highlighted points: none. 5) BASF logo, a white BASF wordmark with a small white square mark and the tagline We create chemistry, on a solid #004A96 rectangle (about 78.8% to 100% across, 88.8% to 96.7% down); the logo image itself is about 79.8% to 86.4% across, 90.8% to 95.1% down.
Slide 17
We are accelerating value creation in Industrial Solutions
Grow with leading market positions
Accelerate growth in electronic materials
Drive cost efficiencies
Leverage investments, drive capital efficiency
Targeted EBITDA bsi increase of
€400 million
– €500 million
by 2028
+40%
2023
2028
1
2
3
4
16
BASF Capital Markets Day, September 26/27, 2024 | Industrial Solutions
We create chemistry
Visuals: One bar chart with a curved annotation arrow. Type: column chart, two bars, no axis numbers printed. Categories on the horizontal axis: 2023 and 2028. Bar 2023 is light grey (#C0C0C0), height about 60 percent of bar 2028 (no value printed). Bar 2028 is dark blue (#004A96), tallest bar, no value printed. Annotation: a thin dark blue curved arrow starting above the 2023 bar and ending with an arrowhead above the 2028 bar, labelled +40% in bold dark blue. Horizontal baseline in grey beneath both bars. No chart title, no legend, no gridlines. Four numbered icons on the left: 1 a bar chart with an upward trend arrow; 2 a microchip with circuit traces; 3 a hand palm-up holding a euro coin; 4 a gear with a euro symbol at its centre. Each icon sits in a square outline with a dark blue triangle in the top-left corner holding the white number. The background photograph is a blurred laboratory or industrial scene in pale blue and white, with a swoosh of blue, orange, green and red stripes across the upper part and a blurred gloved hand at the bottom. A BASF logo (white square mark with dot, wordmark BASF in white bold capitals) sits on a dark blue block with the white tagline We create chemistry.
Slide 18
We create chemistry
Visuals: Logo: the BASF corporate logo, a white lockup of a hollow square and a small solid square followed by the wordmark BASF in heavy white sans-serif capitals, placed above the white tagline 'We create chemistry'. No photographs, charts or other graphics.
Download this deck
The hosted PDF of every library deck is free for readers of the SlideDeck Co newsletter. Join with your email and the viewer and download appear here.
Preparing a results presentation or business update of your own? The SlideDeck Co Standard Deck is a slide library for business reviews, updates and plans.







