
Apollo's 2024 Investor Day deck opens with a title slide, then a long forward-looking statements and disclosures page, followed by a welcome from the Global Head of Investor Relations and an agenda listing each presenter. The strategy section comes next, covering a decade of shareholder returns, progress against 2021 targets, the industry backdrop and new five-year growth targets. Business unit sections follow for asset management (investing and origination), credit, equity, real assets, capital formation, institutional capital, capital solutions, global wealth, retirement services, culture and financial strategy. The deck closes with a summary of takeaways and a Q&A session. It uses a consistent green-and-white template with a section divider before each speaker, large headline-style titles, and a mix of bar charts, timelines and simple diagrams. Several slides, such as the 2021 to 2024 targets scorecard and the Athene ecosystem growth bars, show how a single chart can carry a whole argument. Dense text appears mainly in the legal disclosures and some appendix-style slides. Slide 4 (agenda) and slide 9 (targets scorecard) are worth studying for how they handle information density.
Slides worth studying
Questions about this deck
How many slides does the Apollo Global Management Investor Day 2024 deck have?
The deck has 214 pages. Slide 4 is the Investor Day agenda, which lists each topic, presenter and title.
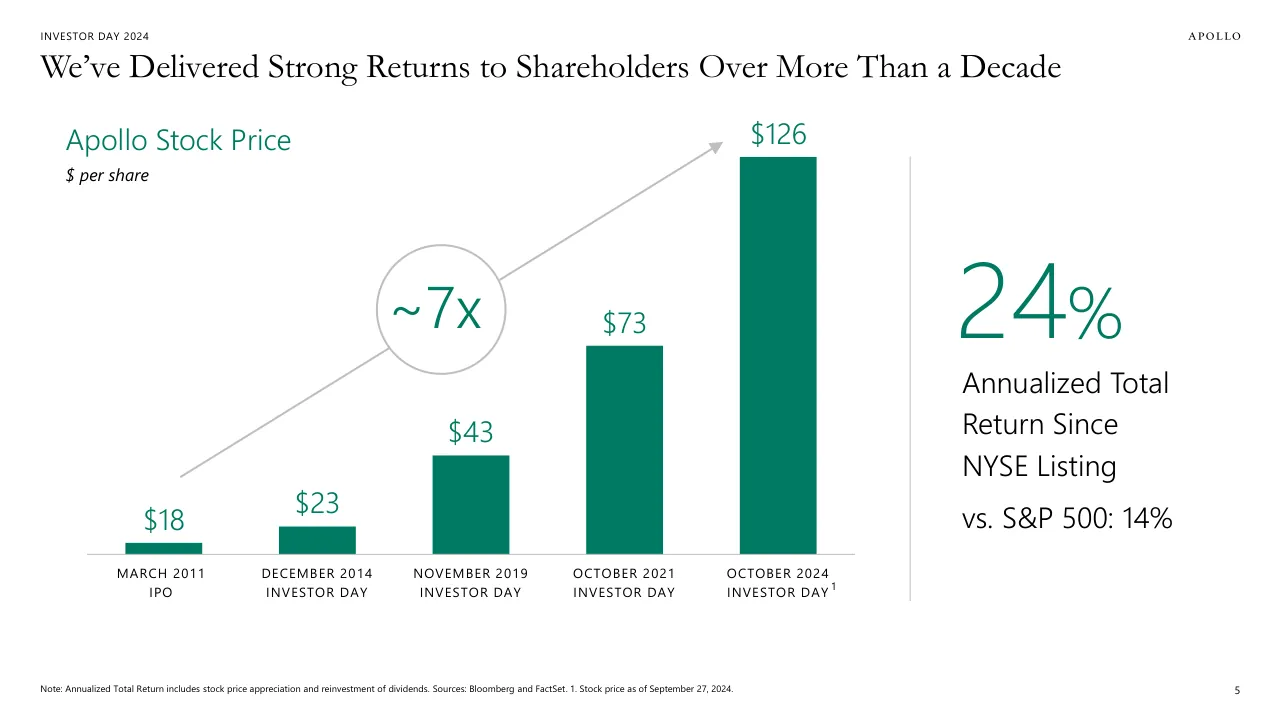
What does the Apollo Global Management Investor Day 2024 deck say about its stock price since the IPO?
Slide 5 shows the Apollo stock price rising from $18 per share at the March 2011 IPO to $126 per share at the October 2024 Investor Day, which is about 7x. The slide also reports a 24% annualized total return since NYSE listing versus 14% for the S&P 500.
What targets does Apollo Global Management set out in the Investor Day 2024 deck for AUM and origination?
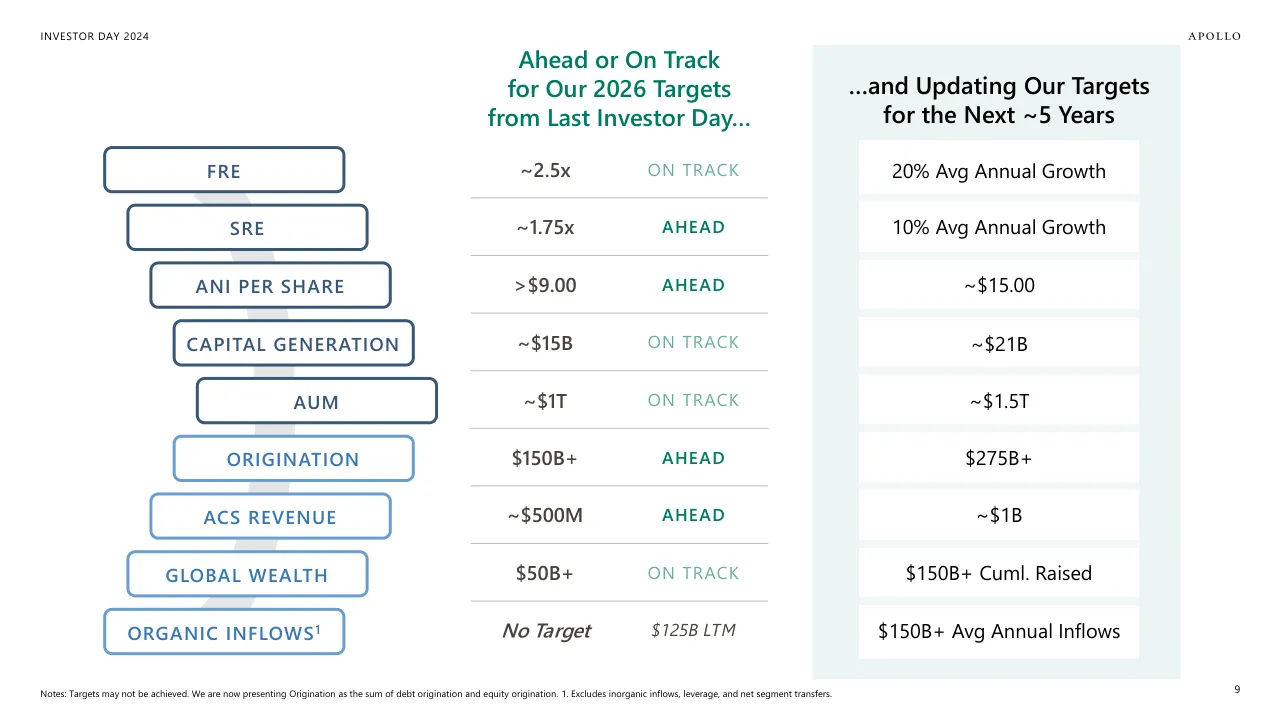
Slide 9 lists AUM of ~$1T with a status of on track for the 2026 target, and an updated target of ~$1.5T for the next five years. For origination, it lists $150B+ as ahead for the 2026 target, with an updated target of $275B+, and notes that targets may not be achieved.
What does the Apollo Global Management Investor Day 2024 deck say about the size of the retirement market?
Slide 15 gives the global retirement market as ~$45 TRILLION. It also states that 1+ BILLION people worldwide will be retirement age by 2030, which the footnote describes as an estimate.
Details
- Company: Apollo Global Management
- Year: 2024
- Type: Investor presentation
- Industry: Asset management
- Pages: 214
Review score: 8 out of 10, Strong
Presentation quality, judged with the SlideDeck Co review heuristic. Ask, evidence and idea merit are not rated here.
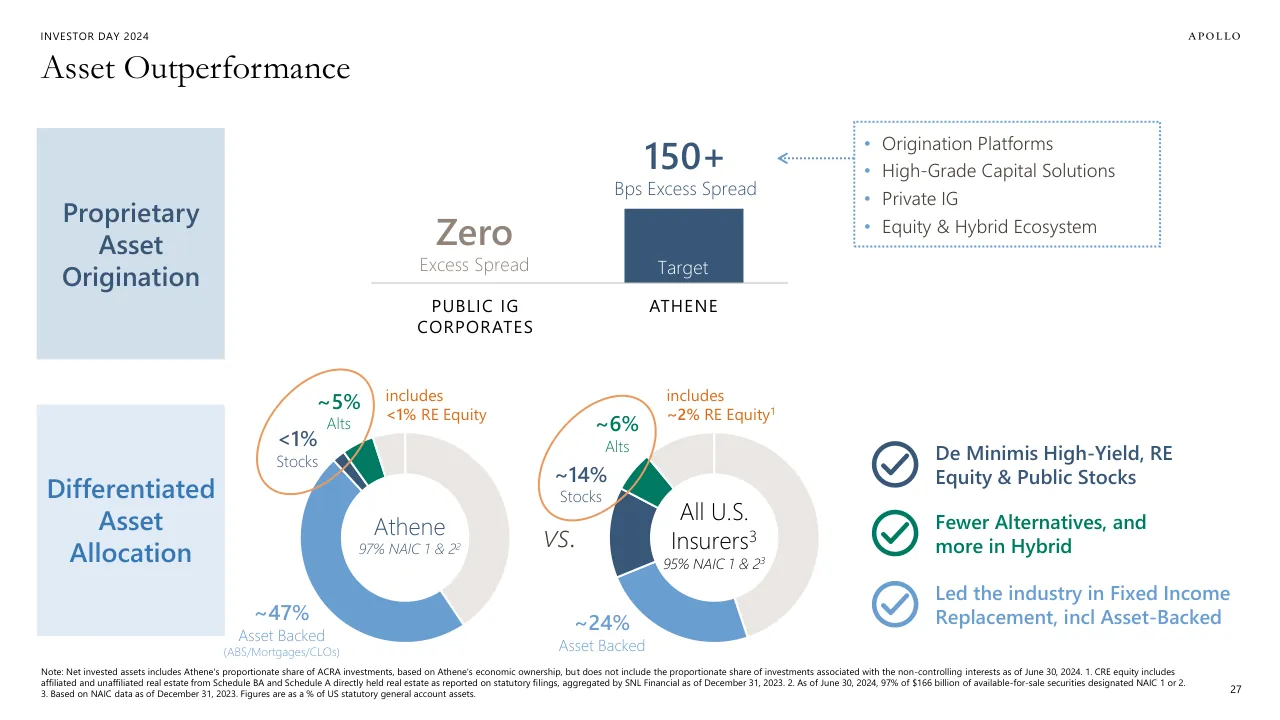
The 72 pages I inspected show a disciplined investor-day template with a consistent green and navy palette, speaker dividers, action titles and large, readable numbers. The argument connects well: returns on slide 5, a targets scorecard on slide 9, then market size, then the business case, with 'perception vs reality' framing on slides 20 and 44 and the originate-then-distribute logic on slides 54 to 66. A few pages weaken the polish: the planet graphics on slide 13 put white numerals over busy textures, the title-less image slides 57 and 72 are hard to read without the speaker, and small footnotes and pie labels on slides 64 and 27 are tiny. I only saw 72 of 214 pages, and the density and image-led pages depend on a spoken presentation.
Worth keeping: Keep the slide 5 and slide 9 chart-plus-callout treatment, the consistent section dividers with speaker names, and the before-and-after comparison layouts on slides 20, 44 and 52.
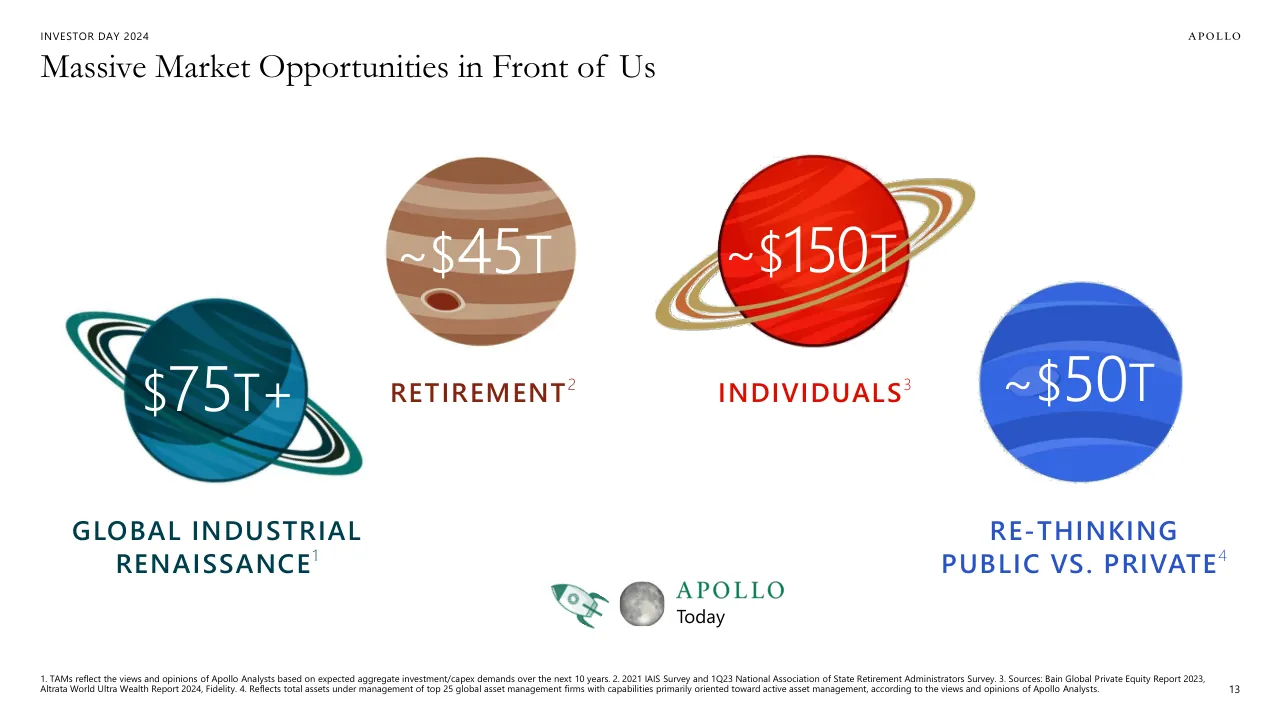
Most useful repair: Replace the planet illustrations on slide 13 with a plain sized-bubble or bar layout so the numbers sit on a clean background and can be compared, and enlarge the labels on slides 27 and 64.
What would change the score: Add a one-line title to the image-only slides 57 and 72, and thin out the footnote and legend text so more of each chart can be read at a distance.
Confidence medium. 72 of 214 pages inspected on contact sheets, 4 at readable size. Reviewed 2026-11-08. Model-assisted review (claude-sonnet-5-5).
Full text of the slides (214 slides)
Every slide's words and a description of its charts and images, so the deck can be searched and rebuilt. Also available as Markdown.
Slide 1
APOLLO
INVESTOR
DAY 2024
Visuals: One full-bleed background illustration (1920 by 1080 px image covering the whole slide). It is a teal gradient with stepped horizontal bands of blue-slate on the right third, arranged as offset rectangles that step in and out in width down the slide. No photographs, charts, logos or icons apart from the APOLLO wordmark, which is typeset text.
Slide 2
INVESTOR DAY 2024
APOLLO
Forward Looking Statements And Other Important Disclosures
This presentation has been prepared by Apollo Global Management, Inc., a Delaware corporation (“HoldCo” and together with its subsidiaries, “Apollo”), solely for informational purposes for its public stockholders and other stakeholders in connection with evaluating the business, operations and financial results of Apollo. References to “Apollo” include Athene Holding Ltd. and its subsidiaries (collectively, “Athene”). This presentation is not intended to and does not constitute an offer to subscribe for, buy or sell, the solicitation of an offer to subscribe for, buy or sell or an invitation to subscribe for, buy or sell any securities, products or services of Apollo, including interests in the funds, vehicles or accounts sponsored or managed by Apollo (each, an “Apollo Product”).
Information and data in the materials are as of June 30, 2024, unless otherwise noted, including information and data labeled “2024”, “Current”, “Today” and similar labeled content. Information and data labeled “Tomorrow”, “Future” and similar labeled content is prospective and aspirational and not intended to denote a particular date in the future unless otherwise noted. Information and data labeled “5 Years” and similar labeled content refers to the year ending or as of December 31, 2029, as applicable, unless otherwise noted, and is prospective and aspirational.
Apollo makes no representation or warranty, express or implied, as to the fairness, accuracy, reasonableness or completeness of the information contained herein, including, but not limited to, information obtained from third parties. Unless otherwise specified, information included herein is sourced from and reflects the views and opinions of Apollo Analysts. Certain information contained in these materials has been obtained from sources other than Apollo. While such information is believed to be reliable for purposes used herein, no representations are made as to the accuracy or completeness thereof and Apollo does not take any responsibility for such information. This presentation may contain trade names, trademarks and service marks of companies which (i) neither Apollo nor Apollo Products own or (ii) are investments of Apollo or one or more Apollo Products. We do not intend our use or display of these companies’ trade names, trademarks or service marks to imply a relationship with, or endorsement or sponsorship of us by, such companies. Company names and logos are trademarks of their respective holders. Certain information contained in the presentation discusses general market activity, industry or sector trends, or other broad-based economic, market or political conditions and should not be construed as research or investment advice. There can be no assurances that any of the trends described herein will continue or will not reverse. Past events and trends do not imply, predict, or guarantee, and are not necessarily indicative of future events or results. This presentation is not complete and the information contained herein may change at any time without notice. Apollo does not have any responsibility to update the presentation to account for such changes. The information contained herein is not intended to provide, and should not be relied upon for, accounting, legal or tax advice or investment recommendations.
This presentation may contain forward looking statements that are within the meaning of Section 27A of the Securities Act of 1933, as amended, and Section 21E of the Securities Exchange Act of 1934, as amended. These statements include, but are not limited to, discussions related to Apollo’s expectations regarding the performance of its business, its liquidity and capital resources and other non-historical statements. These forward looking statements are based on management’s beliefs, as well as assumptions made by, and information currently available to, management. When used in this presentation, the words “believe,” “anticipate,” “estimate,” “target,” “expect,” “intend” and similar expressions are intended to identify forward looking statements. Although management believes that the expectations reflected in these forward looking statements are reasonable, it can give no assurance that these expectations will prove to have been correct. These statements are subject to certain risks, uncertainties and assumptions, including risks relating to inflation, interest rate fluctuations and market conditions generally, the impact of energy market dislocation, our ability to manage our growth, our ability to operate in highly competitive environments, the performance of the funds we manage, our ability to raise new funds, the variability of our revenues, earnings and cash flow, the accuracy of management’s assumptions and estimates, our dependence on certain key personnel, our use of leverage to finance our businesses and investments by the funds we manage, Athene’s ability to maintain or improve financial strength ratings, the impact of Athene’s reinsurers failing to meet their assumed obligations, Athene’s ability to manage its business in a highly regulated industry, changes in our regulatory environment and tax status, and litigation risks, among others. We believe these factors include but are not limited to those described under the section entitled “Risk Factors” in our annual report on Form 10-K filed with the Securities and Exchange Commission (the “SEC”) on February 27, 2024, and our quarterly report on Form 10-Q filed with the SEC on August 8, 2024, as such factors may be updated from time to time in our periodic filings with the SEC, which are accessible on the SEC’s website at www.sec.gov. These factors should not be construed as exhaustive and should be read in conjunction with the other cautionary statements that are included in this presentation and in our other filings with the SEC. We undertake no obligation to publicly update any forward looking statements, whether as a result of new information, future developments or otherwise, except as required by applicable law.
This presentation contains information regarding Apollo's financial results that is calculated and presented on the basis of methodologies other than in accordance with accounting principles generally accepted in the United States ("non-GAAP measures"). These non-GAAP measures are in addition to, and not a substitute for, measures of financial and operating performance prepared in accordance with U.S. GAAP. While we believe that providing these non-GAAP measures is helpful to investors in assessing the overall performance of Apollo’s business, they may not include all items that are significant to an investor’s analysis of our financial results. Please refer to the Reconciliation of GAAP to Non-GAAP Measures section at the end of this presentation for the definitions of non-GAAP measures presented herein, and reconciliations of GAAP financial measures to the applicable non-GAAP measures.
Athene adopted the U.S. GAAP accounting standard related to Targeted Improvements to the Accounting for Long-Duration Contracts (“LDTI”) as of January 1, 2023, which required Athene to apply the new standard retrospectively back to January 1, 2022, the date of Athene’s merger with Apollo. Certain 2022 U.S. GAAP financial metrics and disclosures in this presentation have been retrospectively adjusted in accordance with the requirements of the adoption guidance of LDTI. Please refer to the discussion of Non-GAAP Measures and Definitions herein for additional information on items that are excluded from Athene’s non-GAAP measure of spread related earnings, which was retrospectively adjusted in accordance with the requirements of the adoption guidance of LDTI.
Past performance is not necessarily indicative of future results and there can be no assurance that Apollo or any Apollo Product or strategy will achieve comparable results, or that any investments made by Apollo in the future will be profitable. Actual realized value of currently unrealized investments will depend on, among other factors, future operating results, the value of the assets and market conditions at the time of disposition, any related transaction costs and the timing and manner of sale, all of which may differ from the assumptions and circumstances on which the current unrealized valuations are based. Accordingly, the actual realized values of unrealized investments may differ materially from the values indicated herein. Specific references to investments have been provided on a non-performance based criteria for information purposes only. Apollo makes no guarantee that similar investments would be available in the future or, if available, would be profitable. Not all investments shown are currently held by an Apollo Product.
Please refer to the Appendix for additional important information.
2
Slide 3
WELCOME
NOAH GUNN
Global Head of Investor Relations
APOLLO
INVESTOR DAY 2024
Visuals: One photographic background: an abstract, soft-focus gradient of horizontal and vertical stepped bands with no recognisable subject. It runs from slate blue #3F5A7A at the far left, through teal #1F6B6E, to a saturated green #007B63 in the centre and right, with a lighter green rectangular block stepping out at the right edge around x 65% to 94%, y 16% to 48%. Composition is full-frame and full-bleed, uncropped by any shape, with no people. Lighting is flat, with no shadows. Dominant colours are #007B63 green and #3F5A7A slate. No overlay or tint is applied beyond the image itself. The Apollo Investor Day 2024 logo lockup is a green wordmark: APOLLO in small spaced serif capitals above INVESTOR DAY in bold sans-serif capitals, with a small serif 2024 superscript after DAY, all in #007B63.
Slide 4
INVESTOR DAY 2024 / APOLLO / Investor Day Agenda / TOPIC / PRESENTER / TITLE / Welcome / Noah Gunn / Global Head of Investor Relations / Strategy / Marc Rowan / Chief Executive Officer / Asset Management: Investing & Origination / Jim Zelter / Co-President, Apollo Asset Management / Credit Business / John Zito / Deputy CIO of Credit / Equity Business / David Sambur & / Co-Head of Equity / Matt Nord / Co-Head of Equity / Spotlight: Real Assets / Olivia Wassenaar / Head of Sustainability and Infrastructure / BREAK / Asset Management: Capital Formation / Scott Kleinman / Co-President, Apollo Asset Management / Institutional Capital Formation / Chris McIntyre / Global Head of the Institutional Client Group / Capital Solutions / Eric Needleman / Head of Apollo Capital Solutions / Global Wealth / Stephanie Drescher / Chief Client and Product Development Officer / Retirement Services / Jim Belardi & / Grant Kvalheim / Athene Chairman, Chief Executive Officer, and Chief Investment Officer / Athene USA Chief Executive Officer and President / Culture / Matt Breitfelder & / Bill Lewis / Global Head of Human Capital / Partner and Co-Chair, Partner Committee / Financial Strategy & Capital Priorities / Martin Kelly & / Susan Kendall / Chief Financial Officer / Global Head of Strategic Finance / Closing and Q&A / Marc Rowan & Martin Kelly / 4
Slide 5
INVESTOR DAY 2024
APOLLO
We’ve Delivered Strong Returns to Shareholders Over More Than a Decade
Apollo Stock Price
$ per share
$126
~7x
$73
$43
$23
$18
MARCH 2011
IPO
DECEMBER 2014
INVESTOR DAY
NOVEMBER 2019
INVESTOR DAY
OCTOBER 2021
INVESTOR DAY
OCTOBER 2024
INVESTOR DAY 1
24%
Annualized Total
Return Since
NYSE Listing
vs. S&P 500: 14%
Note: Annualized Total Return includes stock price appreciation and reinvestment of dividends. Sources: Bloomberg and FactSet. 1. Stock price as of September 27, 2024.
5
Visuals: Vertical bar chart titled Apollo Stock Price with unit line $ per share; five bars with value labels above each bar: March 2011 IPO $18, December 2014 Investor Day $23, November 2019 Investor Day $43, October 2021 Investor Day $73, October 2024 Investor Day (footnote 1) $126. Bars are solid #007B63 green, equal width (about 6% of slide width each), bottom-aligned on a thin light grey #BFBFBF baseline spanning about x 6.8% to 66.8% at y 76.9%. Bar heights are proportional to values, starting from zero; the category labels are printed beneath each bar in uppercase. A grey #BFBFBF arrow (about 2px line with filled triangular head) runs diagonally from just above the $18 bar (about x 14%, y 66%) up to just below the $126 label (about x 56%, y 20%), passing behind a circle. The circle is an outlined ring, about 10% wide, with a white interior and a #BFBFBF outline about 2px thick, centred at about x 34.5%, y 43%, containing the text ~7x in green. The right panel contains a large 24% figure in green with the label Annualized Total Return Since NYSE Listing and a second line vs. S&P 500: 14% in black. No photographs, logos other than the APOLLO wordmark, or icons.
Slide 6
INVESTOR DAY 2024
APOLLO
Industry Leadership and Evolution As A Public Company
One Share,
One Vote
Voting structure
aligned
Independent
Chair
Unique among
Alts Peers1
Majority
Independent
Board
Provides
objective
oversight
S&P 500
Eligibility
Largest Financials
company eligible
for S&P 500
index inclusion
1. Alternative asset managers peer group includes ARES, BX, BAM, CG, KKR, OWL, and TPG.
6
Visuals: Four line icons in pale circular badges, left to right. (1) A blue (#5B8FCB) outline envelope with its flap open, an arrow-style chevron pointing right, and a blue outline door/panel, meaning One Share, One Vote. (2) A dark slate-blue (#3B5A7E) outline boardroom scene: an oval/rounded conference table seen from above-front with about six high-backed chairs with five-star castor bases around it. (3) A green (#007B63) outline row of four standing figures, two in dresses and two in trousers, holding hands. (4) An orange (#E8934F) outline coin with a dollar sign inside concentric rings, a vertical line through the S, and an open arc on the lower-right. No photographs. Vertical divider lines are light grey (#C8C8C8) hairlines, about 0.1% wide, spanning from about 19% to 90% of slide height at x about 26.2, 49.9 and 73.6 percent.
Slide 7
STRATEGY
MARC ROWAN
Chief Executive Officer
APOLLO
INVESTOR DAY 2024
Visuals: Abstract background graphic: a smooth horizontal gradient from slate blue-grey at the left edge through teal to a bright green-teal centre band (around 55 to 75% across), then back to slate teal at the right edge. Faint, blurred rectangular blocks form a stepped cross-like pattern: a wide translucent horizontal bar across the middle (about y 17% to 62%), a vertical block near x 66% to 80% spanning y 17% to 83%, and a lighter block extending right at x 80% to 94% between y 38% and 60%. The blocks are only slightly lighter than the background. Logo: 'APOLLO' in small spaced capitals above 'INVESTOR DAY' in bold condensed sans-serif capitals with a small serif '2024' superscript, all in green #007B63, at the bottom right.
Slide 8
INVESTOR DAY 2024
APOLLO
Our 4th Investor Day…
2014
~2x AUM
by 2019
Achieved
in <4 years
2019
~2x AUM & FRE
by 2024
Achieved
in ~4 years
2021
~2.5x FRE, ~1.75x SRE, ~2x ANI
+ Origination, Capital Solutions, Global
Wealth targets by 2026
Ahead or
On Track for
All Metrics
8
Visuals: Three numbered milestone rows, each made of an outlined circle, a pale blue right-pointing chevron, and text. Row 1: navy outlined circle labelled 2014 with a pale blue chevron reading ~2x AUM by 2019, followed by a green outlined check-mark circle and the text Achieved in <4 years. Row 2: navy outlined circle labelled 2019 with a pale blue chevron reading ~2x AUM & FRE by 2024, followed by a green outlined check-mark circle and the text Achieved in ~4 years. Row 3: navy outlined circle labelled 2021 with a larger pale blue chevron reading ~2.5x FRE, ~1.75x SRE, ~2x ANI with the sub-line + Origination, Capital Solutions, Global Wealth targets by 2026, followed by green text Ahead or On Track for All Metrics with no check mark. Check marks are thin green strokes inside green outlined circles. No photographs, no charts, no icons other than the checks.
Slide 9
INVESTOR DAY 2024 / APOLLO / Ahead or On Track / for Our 2026 Targets / from Last Investor Day… / FRE / ~2.5x / ON TRACK / 20% Avg Annual Growth / SRE / ~1.75x / AHEAD / 10% Avg Annual Growth / ANI PER SHARE / >$9.00 / AHEAD / ~$15.00 / CAPITAL GENERATION / ~$15B / ON TRACK / ~$21B / AUM / ~$1T / ON TRACK / ~$1.5T / ORIGINATION / $150B+ / AHEAD / $275B+ / ACS REVENUE / ~$500M / AHEAD / ~$1B / GLOBAL WEALTH / $50B+ / ON TRACK / $150B+ Cuml. Raised / ORGANIC INFLOWS 1 / No Target / $125B LTM / $150B+ Avg Annual Inflows / …and Updating Our Targets / for the Next ~5 Years / 9 / Notes: Targets may not be achieved. We are now presenting Origination as the sum of debt origination and equity origination. 1. Excludes inorganic inflows, leverage, and net segment transfers.
Visuals: Nine outlined rounded rectangles stacked as a funnel, top to bottom: FRE, SRE, ANI PER SHARE, CAPITAL GENERATION, AUM (dark navy outline, about 0.4% of slide height stroke, white fill), then ORIGINATION, ACS REVENUE, GLOBAL WEALTH, ORGANIC INFLOWS (lighter steel-blue outline, same stroke, white fill). Behind the boxes a soft light-grey diagonal band (about #E6E6E6) runs from the top of the FRE box to the bottom of the ORGANIC INFLOWS box, visible in the gaps between boxes. Centre column: a table with three columns (target value, status, footnote-free) and nine rows separated by thin grey hairlines (about #BFBFBF, 0.1% stroke): row 1 ~2.5x / ON TRACK; row 2 ~1.75x / AHEAD; row 3 >$9.00 / AHEAD; row 4 ~$15B / ON TRACK; row 5 ~$1T / ON TRACK; row 6 $150B+ / AHEAD; row 7 ~$500M / AHEAD; row 8 $50B+ / ON TRACK; row 9 No Target / $125B LTM (bold italic and italic). Right column: nine white rectangular cards on a pale teal panel, stacked with small gaps, holding in order: 20% Avg Annual Growth; 10% Avg Annual Growth; ~$15.00; ~$21B; ~$1.5T; $275B+; ~$1B; $150B+ Cuml. Raised; $150B+ Avg Annual Inflows. Logo: APOLLO wordmark in spaced serif capitals, black, top right. No photographs or charts.
Slide 10
INVESTOR DAY 2024
APOLLO
Our Industry Has Been Propelled by Powerful Tailwinds
7x
6x
5x
4x
2x
2x
2x
S&P 500
Oracle
Traditional Asset
Managers 1
Microsoft
Visa
Alternative Asset
Manager Peers 2
Apollo
15-Year Revenue Growth
Note: Revenue calculated from fiscal Q1 2009 to Q2 2024. Based on revenue as disclosed in public company filings. 1. Traditional asset managers represents AMG, BEN, BLK, FHI, IVZ, TROW, STT, WETF. 2. Alternative Asset Manager Peers includes KKR and Blackstone fee related revenues.
10
Visuals: One vertical bar chart, no title inside the chart area, no visible y-axis or gridlines, a thin horizontal baseline at the foot of the bars. Seven bars, left to right, each labelled with its multiple printed above it: S&P 500 2x (light grey #EBEBEB), Oracle 2x (light grey #EBEBEB), Traditional Asset Managers 2x (light grey #EBEBEB), Microsoft 4x (light grey #EBEBEB), Visa 5x (light grey #EBEBEB), Alternative Asset Manager Peers 6x (mid grey #D9D9D9), Apollo 7x (teal #007B63, highlighted). Bar heights are proportional to the printed values, with the 7x bar about 49% of the slide height and the 2x bars about 13% to 15%. Category labels sit under each bar; the 1 and 2 superscripts mark footnote references. No legend. The Apollo bar and its 7x value are the only highlighted points. Below the chart a grey banner (#F2F2F2) carries the label 15-Year Revenue Growth. The APOLLO wordmark at top right is a text logo in black serif capitals.
Slide 11
INVESTOR DAY 2024
APOLLO
An Amazing Time for Our Industry: Play to Win or Risk Reverting to the Mean
Play Not to Lose
Play to Win
Blockbuster
BlackBerry
Kodak
Netscape
Reebok
Motorola
Sears
Barnes & Noble
Toys R Us
Circuit City
RadioShack
Domino's Pizza
Apple
NETFLIX
ABInBev
NIKE
Coca-Cola
Microsoft
intuit
Walmart
amazon
AMERICAN EXPRESS
Note: All rights to the trademarks and/or logos presented herein belong to their respective owners and Apollo's use hereof does not imply an affiliation with, or endorsement by, the owners of these logos.
11
Visuals: Twenty-two trademark logos, all flat, unframed and placed on the white background, listed in the elements. No photographs, charts or tables. Left column (Play Not to Lose): Blockbuster ticket-style blue logo; BlackBerry wordmark with pixel-dot prefix in black; Kodak wordmark in red; Netscape 'N' badge in teal and black with 'Netscape' wordmark in black; Reebok wordmark and vector in black; Motorola 'M' roundel in black with 'MOTOROLA' wordmark in black italic; Sears wordmark in blue outlined letters; Barnes & Noble wordmark in dark green with orange ampersand; Toys R Us wordmark in multicoloured letters with a blue R; Circuit City red circle with white 'circuit city' lettering; RadioShack red circle 'R' with black wordmark. Right column (Play to Win): Domino's Pizza red and blue tilted tile with white lettering; Apple black apple silhouette; NETFLIX wordmark in red; ABInBev yellow and black wordmark; NIKE black swoosh with black wordmark; Coca-Cola red script wordmark; Microsoft four-colour square logo with grey wordmark; intuit blue wordmark; Walmart blue wordmark with yellow spark; amazon black wordmark with orange smile arrow; AMERICAN EXPRESS blue wordmark in bold capitals.
Slide 12
INVESTOR DAY 2024
APOLLO
Apollo’s 35-Year Journey
POST-MERGER
Platforms
ADIP
Capital Solutions
Wealth
POST-GFC
Credit
Athene
AT FOUNDING
Private Equity
Consistently Growing Our Foundation & Expanding Our Capabilities Through Cycles
12
Visuals: Diagram of three rectangular stage boxes connected by dotted elbow arrows. Bottom box 'AT FOUNDING' (header bar #007B63 teal-green, white caps text 'AT FOUNDING'; body white with 2px #007B63 outline) contains 'Private Equity' in #007B63. A dotted #66B199 green elbow connector runs up from the top of this box, then right, ending in a filled green arrowhead pointing into the left edge of the middle box. Middle box 'POST-GFC' (header bar #385878 navy with white caps text; body white with 2px #385878 outline) contains 'Credit' and 'Athene' in #385878 side by side. A dotted #889BAE grey-blue elbow connector runs up from the top of the middle box, then right, ending in a grey arrowhead pointing into the left edge of the top box. Top box 'POST-MERGER' (header bar #EC9A5F orange with white caps text; body white with 2px #EC9A5F outline) contains a 2x2 grid: 'Platforms' and 'ADIP' on the first row, 'Capital Solutions' and 'Wealth' on the second, all in #DE6C1A orange. Behind each box is a wide horizontal block arrow with a pale tint and a triangular head at the right: bottom arrow #EBF5F3 (mint, spanning from the bottom box to the right, head near x 90), middle arrow #E3ECF6 (pale blue), top arrow #FBEBDF (pale peach). Arrow shafts are flat rectangles and heads are isosceles triangles pointing right, no shadows.
Slide 13
INVESTOR DAY 2024
APOLLO
Massive Market Opportunities in Front of Us
~$45T
~$150T
~$50T
$75T+
RETIREMENT
2
INDIVIDUALS
3
GLOBAL INDUSTRIAL
RENAISSANCE
1
RE-THINKING
PUBLIC VS. PRIVATE
4
Today
1. TAMs reflect the views and opinions of Apollo Analysts based on expected aggregate investment/capex demands over the next 10 years. 2. 2021 IAIS Survey and 1Q23 National Association of State Retirement Administrators Survey. 3. Sources: Bain Global Private Equity Report 2023, / Altrata World Ultra Wealth Report 2024, Fidelity. 4. Reflects total assets under management of top 25 global asset management firms with capabilities primarily oriented toward active asset management, according to the views and opinions of Apollo Analysts.
13
Visuals: Four planet illustrations in a flat, painted-texture style on white, left to right: (1) a teal planet with a dark-teal and cream-striped ring system tilted diagonally, containing the value $75T+; (2) a brown and tan banded planet with a dark red oval spot near its lower third and no rings, containing ~$45T; (3) a bright red planet with a dark red outline and a tan and gold ring system tilted across its middle, containing ~$150T; (4) a blue planet with lighter blue horizontal bands and no rings, containing ~$50T. All four are unboxed and sit on white, with no overlay or tint. Bottom centre: a small teal line-art rocket icon and a grey shaded moon, placed beside a green serif APOLLO wordmark with 'Today' in black sans-serif beneath it. No charts or tables. Dominant colours: teal #1A7F8E, brown #A8705A, red #E0200F, blue #3D6FE0.
Slide 14
INVESTOR DAY 2024 / APOLLO / Global Industrial Renaissance: Capital Supply / Demand Imbalance / Massive / Capital Demand / Full Solutions / in Limited Supply / Energy Transition 1 / ~$30-50T+ / Power & Utilities 1 / ~$30T / Digital Infrastructure 1 / ~$15-20T+ / Long-Term / Capital / Spectrum of / Cost of Capital / Capabilities to / Structure Solutions / APOLLO / BRIDGING THE / SUPPLY / DEMAND / IMBALANCE / 1. TAMs reflect the views and opinions of Apollo Analysts based on expected aggregate investment/capex demands over the next 10 years. / 14
Visuals: Three line icons in the left column, each inside a pale mint circle and drawn in green #007B63 with thin strokes: (1) a wind turbine with three blades and wind-swirl lines beside a row of solar panels, (2) a single-circuit electricity pylon in lattice form, (3) a microchip with a square die in the centre and pins along all four sides. Three line icons in the right column, each inside a pale grey circle and drawn in slate #385878 with thin strokes: (1) an hourglass, (2) two horizontal arrows, one pointing left above one pointing right, (3) a brick wall with one brick tilted on top. In the centre, a light grey (about #E4E6E8) line drawing of a suspension bridge with two arched towers and vertical suspenders, sitting above the APOLLO wordmark; the wordmark is a green #007B63 serif wordmark in spaced capitals. Two half-diamond chevrons flank the centre: the left one pale mint #E9F3F1 pointing left, the right one pale grey #EDF0F3 pointing right, both with flat inner edges against the centre column. No photographs or charts.
Slide 15
INVESTOR DAY 2024
APOLLO
Massive Need for Retirement Products, with New Solutions on the Horizon
~$45
TRILLION1
Global Retirement Market
1+ BILLION
People Worldwide will be Retirement Age by 2030²
New Markets
Defined Contribution / 401(k)
Guaranteed Lifetime Income
Tax-Advantaged Products
Structured Settlements
Stable Value
RILA³
New International Opportunities
Adjacent Markets
1. 2021 IAIS Survey and 1Q23 National Association of State Retirement Administrators Survey. 2. Estimate based on data from United Nations’ Department of Economic and Social Affairs for people worldwide over the age of 65 by 2030. 3. Represents registered index-linked annuities.
15
Visuals: Illustration-style composition with no photographs. (1) Large filled circle, centred at about x 20.6%, y 48.1%, diameter about 28.8% of slide width, fill #E8F0F8, containing the statistic '~$45 TRILLION1', 'Global Retirement Market', '1+ BILLION' and 'People Worldwide will be Retirement Age by 2030²' in the circle and below it. (2) Solid chevron/triangle arrow, fill #D4CFC9, pointing right, apex at about x 45.0%, spanning y 38.9% to 74.8% at its left edge, x 40.1% to 45.2%. (3) Staircase diagram of seven outlined rectangles, each white fill with a thin blue or green outline about 2 px wide, stepping up from bottom-left to top-right: bottom 'New International Opportunities' (blue #3777B4 outline and text, x 53.8%, y 83.0%, w 15.0%, h 8.0%); 'RILA³' (blue, x 57.7%, y 73.7%); 'Stable Value' (blue, x 61.6%, y 64.3%); 'Structured Settlements' (blue, x 65.6%, y 55.0%); 'Tax-Advantaged Products' (green #007B63 outline and text, x 69.5%, y 45.7%); 'Guaranteed Lifetime Income' (green, x 73.4%, y 36.3%); 'Defined Contribution / 401(k)' (green, x 77.4%, y 27.0%). No arrows connect the boxes; they step diagonally. (4) Faint light-grey diagonal arrow behind the staircase, colour about #E6E6E6, thick stroke, running from about x 43.5%, y 90% up to an arrowhead at about x 96%, y 14%. (5) Two square-bracket shapes: a mint bracket about #C8E3DA at x 63.4%, y 26.7%, w 2.6%, h 26.5%, enclosing the three green boxes and labelled 'New Markets'; and a grey bracket about #DCE2E6 at x 81.0%, y 54.6%, w 2.4%, h 36.5%, enclosing the lower four boxes and labelled 'Adjacent Markets'. Lighting and photography: none.
Slide 16
INVESTOR DAY 2024
Individual Investor Opportunity
APOLLO
~$150T
TAM
~50% Private
Family / Office
High Net / Worth
~2% Private
Mass Affluent
~1% Private
INDUSTRY / DIRECTION / OF TRAVEL
Sources: Bain Global Private Equity Report 2023, Altrata World Ultra Wealth Report 2024, Fidelity.
16
Visuals: Diagram: a pyramid of three stacked trapezoidal tiers, apex at top. Top tier (Family Office) is pale blue #E3ECF6 with the label Family Office in dark slate #385878. Middle tier (High Net Worth) is mid blue #699ED1 with white bold label High Net Worth. Bottom tier (Mass Affluent) is dark slate #385878 with white bold label Mass Affluent. The tiers share a common vertical centre axis, and the bottom tier is the widest. Grey hairline leader lines (#BFBFBF, about 0.1% stroke) run horizontally from the left edge of the tier boundaries at the top and middle tiers to the percentage labels. Left element: a pale blue circle #E8F0F8 holding ~$150T in light blue #3777B4 with TAM beneath in bold letter-spaced caps; a pale blue (#E8F0F8) bracket with a vertical stem and short horizontal ends at top and bottom spans the circle's height. Right element: a thin light grey (#D9D9D9) diagonal arrow runs from upper left to lower right, ending in a filled grey arrowhead, and passes into a white circle outlined in light grey (#D9D9D9) that holds the label INDUSTRY / DIRECTION / OF TRAVEL in slate #385878. No photographs, logos or icons other than the APOLLO wordmark.
Slide 17
INVESTOR DAY 2024
APOLLO
Re-Thinking Public vs. Private
NEXT TARGET
FUTURE TARGET
FIXED INCOME
REPLACEMENT
EQUITY
REPLACEMENT
Alternatives
Fixed Income
Equities
Enabled by…
Apollo Ecosystem
Standardized Credit Ratings
17
Visuals: Three bucket illustrations and a grey arrow band. (1) Alternatives: a small green (#007B63-family) cartoon bucket with a handle and a measurement scale on its side, sitting at left under a green outlined check-mark circle (about 0.2 of slide width diameter) with a small teal chevron arrow to its right; the bucket is about 8.9% wide by 21% tall at x 13.9, y 45.5. (2) Fixed Income: a larger red bucket (about 15.1% wide by 35.8% tall at x 36.4, y 30.7) with a brown-gold handle and gold rim cap, black outline, glossy highlight and darker red shading on the right side, with five tick marks on its side; it sits inside an orange (#F0A060-ish) rectangle outline. A teal chevron sits between the first and middle column. (3) Equities: a blue bucket of the same size (x 65.1, y 30.7) with light-blue handle and rim cap, blue-steel body (#6A93C4-ish) with lighter highlight and five tick marks; it sits inside an orange dotted rectangle outline. A teal chevron sits between the middle and right column. Behind the buckets is a light grey (#F2F2F2) horizontal band with a large light grey arrowhead pointing right at the far right edge, roughly 3% to 97% of slide width. Illustrations are flat cartoon style with no photographic lighting, unboxed on white.
Slide 18
INVESTOR DAY 2024 / APOLLO / Re-Thinking Public vs. Private / Dealer Inventory vs. / Corporate Bonds Outstanding1 / Indexation & Correlation / $ T / $ B / 10 / 300 / 9 / 250 / 8 / 7 / 200 / 6 / 5 / 150 / 4 / 3 / 100 / 2 / 50 / 1 / 0 / 0 / 2001 / 2003 / 2005 / 2007 / 2009 / 2011 / 2013 / 2015 / 2017 / 2019 / 2021 / TOTAL STOCK OF US CORPORATE BONDS OUTSTANDING (LS) / PRIMARY DEALER INVENTORY OF CORPORATE BONDS (RS) / • 10 COMPANIES = record high 36% / of the S&P 500 Index2 / Apple / Google / VISA / Lilly / NVIDIA / amazon / BERKSHIRE HATHAWAY / Microsoft / Meta / Tesla / • S&P 500 = 85% of the Total Equity Market Cap2 / 1. Sources: Bloomberg, Apollo Chief Economist, chart data reflects period from January 1, 2012, through December 31, 2022. 2. Source: Bloomberg as of September 26, 2024, Apollo Chief Economist. All rights to the trademarks and/or logos presented herein belong to their respective / owners and Apollo's use hereof does not imply an affiliation with, or endorsement by, the owners of these logos. / 18
Visuals: Chart (line chart, dual axis): title 'Dealer Inventory vs. Corporate Bonds Outstanding' with superscript 1. Left axis labelled '$ T' with ticks 0 to 10 in steps of 1 (trillions of dollars). Right axis labelled '$ B' with ticks 0, 50, 100, 150, 200, 250, 300 (billions of dollars). X axis years 2001 to 2021 labelled every two years, plotted roughly 2001 to 2022. Series 1, 'TOTAL STOCK OF US CORPORATE BONDS OUTSTANDING (LS)', pale sage line plotted on the left axis; about 1.8 T in 2001, about 2.3 T in 2007, about 3.3 T in 2009, about 5 T in 2012, about 7 T in 2017, about 9.6 T at the end in 2022; no values printed. Series 2, 'PRIMARY DEALER INVENTORY OF CORPORATE BONDS (RS)', dark teal jagged line plotted on the right axis; about 35 B in 2001, peak about 290 B around 2007, falling to about 130 B by 2009, about 50 B around 2015, about 25 B at the end in 2022; no values printed. Shaded recession bands in light grey #F2F2F2 span about 2001, about 2007.5 to 2009, and about 2019.7 to 2020.2, full plot height. Legend below the plot: a pale sage line swatch with the LS label and a dark teal line swatch with the RS label, both in letter-spaced capitals. No points highlighted. Right side: a light grey #F2F2F2 rectangle holding a 3 by 4 grid of ten company logos: Apple (black apple silhouette), Google (multicolour G), VISA (blue wordmark), Lilly (red script wordmark), NVIDIA (green eye emblem with black wordmark), Amazon (black a with orange smile arrow), Berkshire Hathaway (purple serif wordmark), Microsoft (four-square logo red, green, blue, yellow), Meta (blue infinity symbol with black wordmark), Tesla (red T emblem). Logos are in full colour, unboxed, sitting on the grey panel. Rows: row one Apple, Google, VISA, Lilly; row two NVIDIA, Amazon, Berkshire Hathaway, Microsoft; row three Meta and Tesla, centred.
Slide 19
INVESTOR DAY 2024
Apollo is Uniquely Built for the Market Opportunity
19
Slide 20
INVESTOR DAY 2024
APOLLO
PERCEPTION
What People Think
Constrains the Industry…
WHAT ACTUALLY
REALITY
What Actually
Constrains the Industry…
Ability to Raise Capital
Capacity to Originate
Right Cost & Form of Capital
Culture
Apollo Is Uniquely
Built With This In Mind
20
Visuals: A set of outlined boxes and a downward-pointing triangle, no photographs or charts. Left column: one red (#C00000) outlined rectangle at x 7.5%, y 32.5%, w 45%, h 10%, containing 'Ability to Raise Capital'. Right column: three green (#007B63) outlined rectangles stacked, each about w 37.5%, all at x 49.2%: 'Capacity to Originate' at y 32.5%, h 10%; 'Right Cost & Form of Capital' at y 45.2%, h 10%; 'Culture' at y 58.2%, h 10%; gaps of about 2.7% between them. Below them a light grey (#E6E6E6) downward-pointing triangle, flat, at x 68.9%, y 72.8%, w 10.6%, h 4.0%, centred under the boxes. Vertical divider line in light grey, about 1 px wide, at x 50%.
Slide 21
INVESTOR DAY 2024
APOLLO
Investment Culture Grounded in High Performance & Alignment
TOP HOME FOR TALENT
“Best Place to be a Partner”
Investment Culture
PURCHASE
PRICE MATTERS
EXCESS RETURN
PER UNIT OF RISK
Innovation
DEALS
PLATFORMS
NEW
PRODUCTS
intel
ATLAS SP
Altitude
UNPARALLELED ALIGNMENT
Aligned
Compensation
$6B+ Employee
Stock Ownership1
~$2B Employee Investments
in Apollo Funds2
1. Based on APO share price as of September 27, 2024. 2. As of April 30, 2024.
21
Visuals: Three logo elements in the left panel under the Innovation heading: the intel wordmark in blue (about #0071C5) with a light-blue dot, the ATLAS SP logo (a green hexagonal-ring icon about #00A07A followed by dark navy #1B2A3A caps text) and the Altitude logo (a circular ring in dark green-blue about #007B63 and #0060A9 containing the word Altitude in light blue; tiny lettering above it is not legible). Centre badge: a dark green (#007B63) serif capital A inside a thin pale mint circle outline (about #C8E3DA) with white interior. Two light grey rules divide each panel into three bands on each side. No photographs, charts or tables.
Slide 22
INVESTOR DAY 2024
APOLLO
The Ability to Originate Assets
That Offer Alpha (Excess Return)
is the Key Driver of Our Business
Slide 23
INVESTOR DAY 2024 / APOLLO / Building & Owning Recurring Origination is Essential / Origination Platforms1 / ~4,000 / Employees / ~$8B Equity / Invested / + / MidCap Financial / ATLAS SP / PK AirFinance / REDDING RIDGE / ASSET MANAGEMENT / High-Grade Capital Solutions / intel. / AIRFRANCE / ABInBev / AT&T / ~$80B / $164B / $275B+ / Investor Day 2021 / Annual Run-Rate / LTM 2Q'24 / 2029E / Note: The 5-year target is now inclusive of all Origination, both debt origination and equity origination. 1. Origination Platforms are portfolio companies of funds managed by Apollo. / 23
Visuals: Vertical bar chart with no chart title and no legend. Three bars share one baseline at about y 83.4% of slide height, with a thin light-grey horizontal axis line beneath them. Bar 1 (x-label 'Investor Day 2021 / Annual Run-Rate'): solid green #007B63 bar, value label '~$80B' printed above it; height about 15.7% of slide height, which is about 80 on a bar scale where the 2029E bar equals 275. Bar 2 (x-label 'LTM 2Q'24'): solid green #007B63 bar, value label '$164B' printed above it, height about 29.5% of slide height. Bar 3 (x-label '2029E'): pale mint #CCE5E0 bar, value label '$275B+' printed above it in green #007B63, height about 49.0% of slide height. No value axis, gridlines or scale are printed. Above the bars a light-grey #BFBFBF straight arrow runs diagonally from just above bar 2 (about x 26.2%, y 45.8%) up and to the right to about x 33%, y 30.4%, with a filled triangular arrowhead at the upper end, pointing toward the top of the 2029E bar. Right column: two light-grey #F3F5F7 rounded-less rectangles (panels) side by side, the left containing '~4,000' over 'Employees' and the right containing '~$8B Equity' over 'Invested'; between them a large light-grey #BFBFBF plus sign. Below them, a 2 by 2 grid of company logos: MidCap Financial (green X mark with navy 'MidCap' and blue 'Financial'), ATLAS SP (teal-green hexagonal ring icon with dark navy 'ATLAS SP' wordmark), PK AirFinance (grey stylised 'PK' with 'AirFinance' in grey sans-serif), and Redding Ridge Asset Management (green, dark navy and grey diamond emblem with letters R, A, M, followed by 'REDDING RIDGE' and 'ASSET MANAGEMENT' in dark navy serif capitals). Below a second heading, a row of logos: intel. (blue lowercase wordmark with light-blue dot), AIRFRANCE (navy capitals with red swoosh), then ABInBev (yellow globe mark and black wordmark) and AT&T (light-blue globe and black 'AT&T').
Slide 24
INVESTOR DAY 2024
APOLLO
Assets Are Scarce; We Are Aligned With Our Clients to Maximize Value
1
2
3
Athene
Balance Sheet
Dedicated
Co-Investment
Third-Party
Capital
ADIP
Apollo-Athene Dedicated
Investment Program
Institutional &
Wealth Clients
AUM
$235B1
$69B
$392B
Fee
Generating
1. Represents Athene AUM excluding ACRA non-controlling interests.
24
Visuals: Three numbered circles (1 green #007B63, 2 slate blue #385878, 3 light blue #699ED1) above three tinted label boxes. Below them: the Athene logo (blue swoosh with grey ATHENE wordmark), the bold text ADIP with a two-line subtitle, and the text Institutional & Wealth Clients. Row AUM shows $235B with superscript 1 (green), $69B (slate blue) and $392B (blue). Row Fee Generating shows three outlined check-mark circles in green, slate blue and light blue. Grey plus signs sit between the label boxes. No chart or photograph.
Slide 25
INVESTOR DAY 2024 / APOLLO / Retirement Services is Core to Our Business Model / APOLLO / Asset Management / Perspective / Retirement Services / Perspective / Capacity to / Originate / Need for / Long-Term Safe Yield / 25
Visuals: Centred circular icon (about 19.8% wide, 35.2% tall region, light grey disc #F2F2F2) containing a grey line-art illustration of two hands shaking (handshake) with three short radiating lines above the clasp, drawn in mid grey #808080 with a stroke about 0.4% of slide height and rounded line caps. Two dotted connector lines in pale teal (left, #8CC7B8-like) and pale slate (right, #9AABBF-like) run horizontally at the vertical midpoint of the boxes from the box edges to the circle. Logo 1: Apollo wordmark 'APOLLO' in widely letter-spaced serif capitals, dark green #007B63. Logo 2: Athene logo, a blue (#1F6FB5-like) stylised fan/wing swoosh to the left of the grey wordmark 'ATHENE' in serif capitals (#4D4D4D).
Slide 26
INVESTOR DAY 2024
We Have Built The Leading Retirement Services Franchise
APOLLO
Athene
Asset Outperformance
Product Distribution
Capital
Cost Structure / Scale
Management
Our Right
to Win in
Retirement
Services
26
Visuals: Five outline-free pale rows as background bars, each with a blue line icon at its left: (1) bulldozer/track loader icon beside Asset Outperformance, solid blue #3777B4 silhouette; (2) wall safe icon with circular dial and handle, outlined in blue, beside Product Distribution; (3) brick wall icon with a cap course at top, solid blue, beside Capital; (4) stack of three coins, outlined in blue, beside Cost Structure / Scale; (5) three-person group silhouette, solid blue, beside Management. Athene logo at top: a stylised blue fan or sweep of curved strokes (#0A6EBD to #3F8FD2) to the left of the grey (#4D4D4D) serif wordmark ATHENE in capitals. Right of the rows, a pale blue (#D6E4F0) square-cornered bracket open to the right, drawn as a vertical line of about 0.4% slide width with horizontal ticks at top and bottom, spanning about y 35% to 100%; from its midpoint at about y 67.6% a pale blue (#D6E4F0) horizontal connector runs right to a solid pale blue triangle arrowhead pointing right, about x 61% to 72%, y 62% to 72%.
Slide 27
INVESTOR DAY 2024
APOLLO
Asset Outperformance
150+
Bps Excess Spread
Zero
Excess Spread
Target
PUBLIC IG
CORPORATES
ATHENE
• Origination Platforms
• High-Grade Capital Solutions
• Private IG
• Equity & Hybrid Ecosystem
Proprietary
Asset
Origination
Differentiated
Asset
Allocation
includes
<1% RE Equity
~5%
Alts
<1%
Stocks
Aathene
97% NAIC 1 & 2 2
includes
~2% RE Equity 1
~6%
Alts
~14%
Stocks
All U.S.
Insurers 3
95% NAIC 1 & 2 3
VS.
~24%
Asset Backed
~47%
Asset Backed
(ABS/Mortgages/CLOs)
De Minimis High-Yield, RE
Equity & Public Stocks
Fewer Alternatives, and
more in Hybrid
Led the industry in Fixed Income
Replacement, incl Asset-Backed
Note: Net invested assets includes Athene's proportionate share of ACRA investments, based on Athene's economic ownership, but does not include the proportionate share of investments associated with the non-controlling interests as of June 30, 2024. 1. CRE equity includes
affiliated and unaffiliated real estate from Schedule BA and Schedule A directly held real estate as reported on statutory filings, aggregated by SNL Financial as of December 31, 2023. 2. As of June 30, 2024, 97% of $166 billion of available-for-sale securities designated NAIC 1 or 2.
3. Based on NAIC data as of December 31, 2023. Figures are as a % of US statutory general account assets.
27
Visuals: Chart 1: bar comparison of excess spread. Two bars on a common baseline: a zero-height bar labelled 'Zero' for PUBLIC IG CORPORATES (grey #938679 text) and a navy bar #385878 labelled 'Target' for ATHENE, with '150+ Bps Excess Spread' printed above it. No axes or scale. A dotted blue arrow (#699ED1) points from the dotted box to the 150+ label. Chart 2: donut chart titled 'Athene', subtitle '97% NAIC 1 & 2 2', centre label. Segments clockwise from top: light grey #EAE7E3 unlabelled remainder, orange-outlined labels: ~5% Alts (green #007B63 segment, small), <1% Stocks (navy #385878 small segment), about 47% Asset Backed (light blue #699ED1 large segment, labelled ~47%), and the grey remainder. Orange ellipse outline (#E8955A-ish, about 2pt) encircles the Alts and Stocks segments at top left. Text 'includes <1% RE Equity' in orange #DE6C1A top right of donut. Chart 3: donut chart titled 'All U.S. Insurers 3', subtitle '95% NAIC 1 & 2 3', centre label. Segments: light grey #EAE7E3 remainder (about 50% at top right), ~6% Alts green #007B63, ~14% Stocks navy #385878, ~24% Asset Backed light blue #699ED1 at bottom. Orange ellipse outline encircles Alts and Stocks. 'includes ~2% RE Equity 1' in orange at top right. Separated 'VS.' italic label left of the donut. Icons: three circular check-mark icons at left of the right-hand statements: navy #385878 outline check, green #007B63 outline check, light blue #699ED1 outline check, each about 3.7% wide. Box: dotted rectangle outline in blue #699ED1 enclosing four bullets with light blue dot bullets. No photographs or logos other than the APOLLO wordmark.
Slide 28
INVESTOR DAY 2024
APOLLO
Product Distribution
Gross Organic Inflows
$70B
$63B
$48B
~23x
$37B
$28B
$18B
$13B
$9B
$11B
$4B
$3B
2014
2015
2016
2017
2018
2019
2020
2021
2022
2023
2024E
RETAIL ANNUITIES
FLOW REINSURANCE
PENSION GROUP ANNUITIES
FUNDING AGREEMENTS
1
2
1. Previously announced target of $70 billion or more of estimated inflows in FY'24. 2. Funding agreements are comprised of funding agreements issued under Athene’s funding agreement backed note (FABN) program, secured and other funding agreements, funding agreements issued to the Federal Home Loan Bank (FHLB) and long term repurchase agreements.
28
Visuals: Stacked vertical column chart titled Gross Organic Inflows, with a subtitle-style label at top left. Eleven columns, one per year from 2014 to 2024E, left to right. Column totals printed above each bar: 2014 $3B, 2015 $4B, 2016 $9B, 2017 $11B, 2018 $13B, 2019 $18B, 2020 $28B, 2021 $37B, 2022 $48B, 2023 $63B, 2024E $70B. No axis scale or gridlines are printed. Segment values are not printed; segments are about proportional to the column heights. Stack order from bottom: Retail Annuities (dark blue #385878), Flow Reinsurance (mid blue #699ED1), Pension Group Annuities (light blue #ABC7E5), Funding Agreements (teal #92CBD6). The 2024E column is split: the top about 27 percent is a grey diagonal hatch on white with a thin grey outline, labelled $70B above it, and is footnote 1 (previously announced target). The 2024E column carries superscript 1 after the year and the legend's Funding Agreements carries superscript 2. A black straight arrow with a filled arrowhead runs from just above the 2014 column up to the upper right near the 2024E label, rising across the chart. A dark blue #385878 ellipse with a thin black outline sits on the arrow near the 2019 to 2020 columns and contains the white text ~23x. Legend below the year axis: four square swatches with labels in order Retail Annuities, Flow Reinsurance, Pension Group Annuities, Funding Agreements. No highlighted points other than the ellipse and the hatched 2024E column.
Slide 29
INVESTOR DAY 2024 / APOLLO / Capital / Primary Equity Capital / Raised Since 2010 / Regulatory Capital Backing Reserves / 1 / $35B / $33B / $28B / $23B / $20B / $19B / $18B / $15B / $13B / $10B / $9B / Rest of Industry / We Have Led the Industry in Raising Capital / Note: Athene and Apollo data as of June 30, 2024. Peer data as of December 31, 2023. 1. Represents the aggregate capital of Athene's U.S. and Bermuda insurance entities, determined with respect to each insurance entity by applying the statutory accounting principles applicable to / each such entity. Adjustments are made to, among other things, assets and expenses at the holding company level. Includes capital from the non-controlling interests in ACRA as well as ~$4B of undrawn, on-demand equity capital in ADIP. For peers, regulatory capital is U.S. statutory / total adjusted capital plus Bermuda total adjusted capital and exclusive of all non-U.S. and Bermuda regulatory capital. / 29
Visuals: Two vertical bar charts with no printed axes, gridlines or axis units; values are printed above each bar. Left chart: 'Primary Equity Capital Raised Since 2010', two bars on a shared baseline: Athene/Apollo $20B (dark blue bar, label in blue) and Rest of Industry $28B (light grey bar, label in dark grey). Right chart: 'Regulatory Capital Backing Reserves' with superscript 1, nine vertical bars on one baseline in descending order, each with a printed value label above and a logo below: MassMutual $35B (light grey bar), Athene $33B (dark blue bar, highlighted, label in blue), Prudential $23B (grey), MetLife $19B (grey), corebridge financial $18B (grey), Manulife $15B (grey), Pacific Life $13B (grey), Lincoln Financial Group $10B (grey), Global Atlantic $9B (grey). Bars are flat rectangles with no legend; the dark blue bars are the only highlighted series. Logos are: MassMutual wordmark with three-dot mark above; Athene wordmark with swoosh mark; Prudential wordmark with round blue emblem above; MetLife wordmark with blue and green icon above; corebridge financial wordmark with purple dot cluster; Manulife wordmark with green three-bar mark above; Pacific Life wordmark with arched emblem above; Lincoln Financial Group with maroon head silhouette; Global Atlantic Financial Group with teal swirl mark. Left chart base logos: ATHENE over APOLLO wordmarks, then the text 'Rest of Industry'. Baselines are thin light grey horizontal lines under each chart, and the divider is a thin vertical grey line (about #BFBFBF, estimated).
Slide 30
INVESTOR DAY 2024
APOLLO
Cost Structure / Scale
0.74%
0.66%
0.61%
0.64%
0.70%
0.62%
0.67%
35bps
of expense
outperformance
0.37%
0.35%
0.35%
0.29%
0.27%
0.25%
0.32%
2019
2020
2021
2022
2023
YTD '24
19-'23 Avg.
ATHENE
INDUSTRY
Note: Figures are U.S. statutory G&A divided by average total U.S. statutory assets. Industry includes: Allianz, Corebridge, Global Atlantic, Mass Mutual, MetLife, Nationwide, New York Life, Pacific Life, and Prudential. Athene GAAP operating expenses divided by average net invested
assets were 0.28% for 2019, 0.24% for 2020, 0.23% for 2021, 0.25% for 2022, 0.23% for 2023, 0.21% YTD ’24 and average 0.25% from 2019-2023.
30
Visuals: Line chart with two series and no visible y-axis or gridlines. Series 1 'ATHENE' is a dark blue line (#385878) with printed values 0.37% (2019), 0.35% (2020), 0.35% (2021), 0.29% (2022), 0.27% (2023), 0.25% (YTD '24). Series 2 'INDUSTRY' is a light grey line (#BFBFBF) with printed values 0.74% (2019), 0.66% (2020), 0.61% (2021), 0.64% (2022), 0.70% (2023), 0.62% (YTD '24). Category axis labels: 2019, 2020, 2021, 2022, 2023, YTD '24, 19-'23 Avg. The value axis has no printed scale or range; the lines are plotted to a common scale with the Industry line sitting above Athene throughout. A separate average pair at the right is shown as filled diamond markers: grey diamond labelled 0.67% (Industry, 19-'23 Avg.) and dark blue diamond labelled 0.32% (Athene, 19-'23 Avg.). A grey bracket with a right-angle connector joins the two diamonds and points to a grey-outlined callout reading '35bps of expense outperformance'. Legend below the axis: dark blue line sample then ATHENE, grey line sample then INDUSTRY. No points are highlighted beyond the average diamonds; no gridlines; the horizontal axis baseline is a thin light grey line. No photographs, icons or logos other than the APOLLO wordmark.
Slide 31
INVESTOR DAY 2024
APOLLO
Management
+$51B
over 5 years
+$99B
over 3 years
+$92B
over 3 years
MANDATORY CONVERTIBLE
ADIP II
ADIP I
$60
$59
$67
$72
$82
$111
$125
$175
$210
$238
$279
$302
2013 2014 2015 2016 2017 2018 2019 2020 2021 2022 2023 2Q'24
Athene Ecosystem Gross Invested Assets1 ($B)
1. Includes the non-controlling interests in ACRA.
31
Visuals: Vertical bar chart titled 'Athene Ecosystem Gross Invested Assets' with superscript 1 and unit ($B), footnote 1 'Includes the non-controlling interests in ACRA.' Categories on x-axis are 2013, 2014, 2015, 2016, 2017, 2018, 2019, 2020, 2021, 2022, 2023, 2Q'24; no y-axis or gridlines are drawn and values are printed above each bar. Series values: 2013 $60B, 2014 $59B, 2015 $67B, 2016 $72B, 2017 $82B, 2018 $111B, 2019 $125B, 2020 $175B, 2021 $210B, 2022 $238B, 2023 $279B, 2Q'24 $302B. Bars 2013 to 2017 are pale grey-blue #E1E6EB, bars 2018 to 2020 are pale blue #E3ECF6, bars 2021 to 2Q'24 are pale mint #DEEEEB. Bar heights are proportional to the printed values with the baseline at y 74. Three grey-blue to green callout boxes sit above the chart. A grey-blue bracket arrow runs from above the 2013 bar ($60) to above the 2018 bar ($111) labelled with the box '+$51B over 5 years'. A blue bracket arrow labelled ADIP I runs from above the 2018 bar to above the 2021 bar ($210) with the box '+$99B over 3 years'. A green bracket arrow labelled MANDATORY CONVERTIBLE above and ADIP II to its right runs from above the 2021 bar to above the 2Q'24 bar ($302) with the box '+$92B over 3 years'. No legend and no highlighted points beyond the bracket arrows.
Slides 32 to 214 continue in the full text file.
Download this deck
The hosted PDF of every library deck is free for readers of the SlideDeck Co newsletter. Join with your email and the viewer and download appear here.
Preparing a results presentation or business update of your own? The SlideDeck Co Standard Deck is a slide library for business reviews, updates and plans.







