
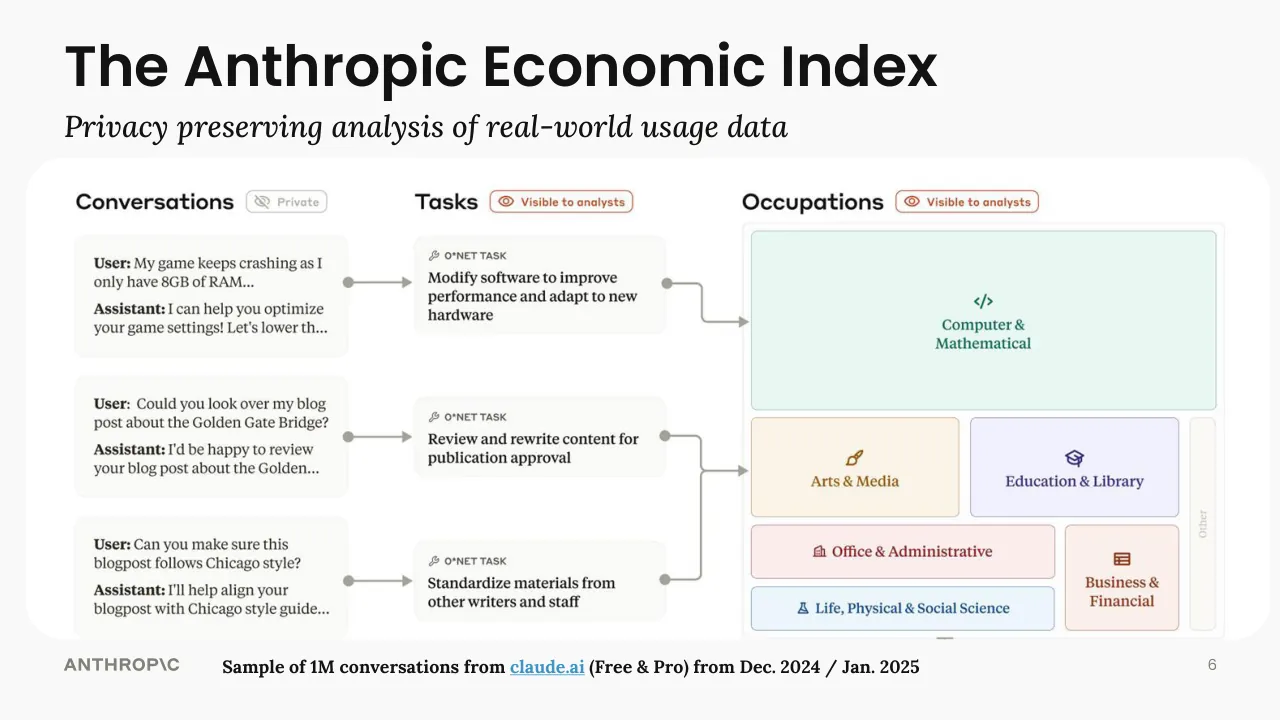
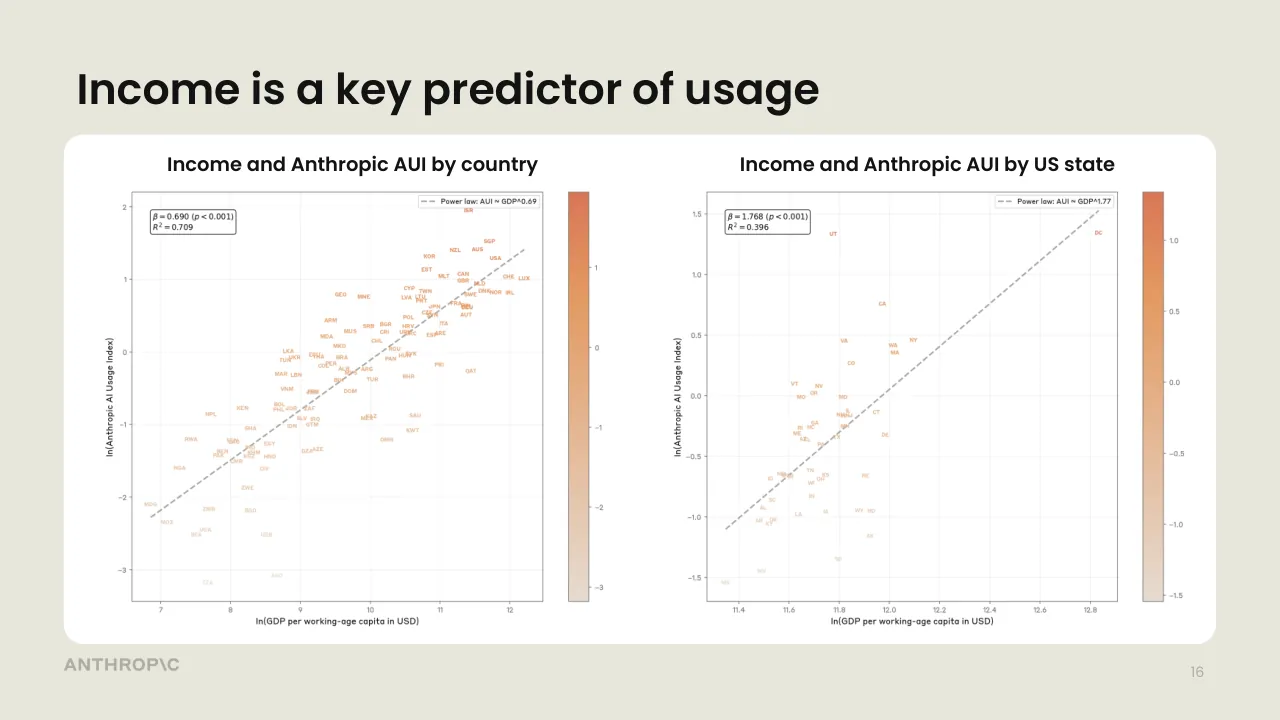
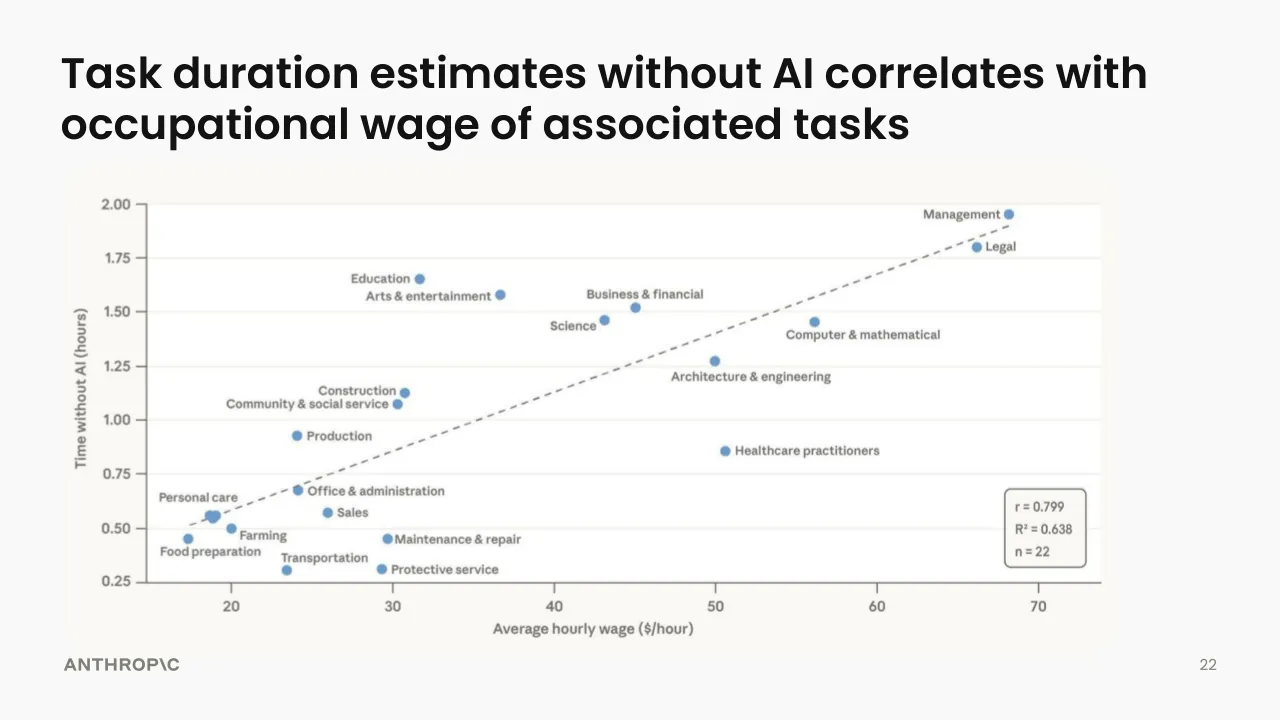
The deck opens with a title slide introducing the Anthropic Economic Index and its head of economics, then sets out a framing slide listing claims about AI as a general purpose technology with uncertain productivity and labour effects, followed by a slide pairing task-length capability growth with the need for better measurement. It then moves through its main sections in order: the privacy-preserving method used to analyse Claude transcripts, usage concentration across tasks, occupations, US states and countries, and a comparison of API and consumer usage patterns. A later section turns to growth and productivity, estimating task durations with and without AI and comparing the implied productivity gain with an OECD estimate. The deck closes with four summary points and a quotation about policy choices. Several slides are section dividers or carry only a single prompt-like line, so the deck relies heavily on charts and short headline claims. Slides 6, 14, 15, 16 and 22 are the most useful to study for how data is presented alongside a single takeaway.
Slides worth studying
Questions about this deck
How many slides does the Anthropic Economic Index presentation have?
The deck has 26 slides, starting with the title slide introducing the Anthropic Economic Index on slide 1 and ending with a logo slide on slide 26.
What does the Anthropic deck say about the productivity gain implied by Claude's task-duration estimates?
Slide 24 states that the increase in labor productivity implied by Claude's task-duration estimates is +1.8%pp, and its title says this is on the upper end of estimates. Slide 23 lists the annual labor productivity contribution for the overall economy as 1.80%.
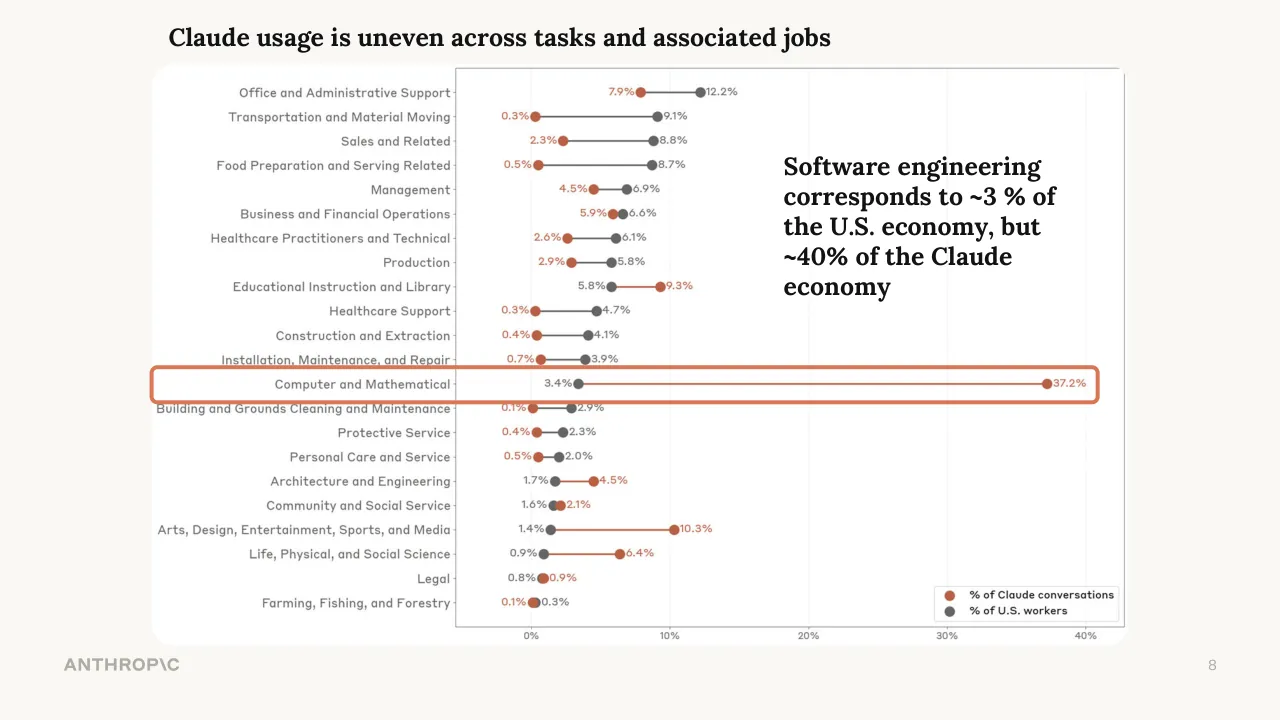
What does Anthropic's presentation say about software engineering's share of the Claude economy?
Slide 8 states that software engineering corresponds to about 3% of the U.S. economy but about 40% of the Claude economy. Slide 4 gives the matching figures for Computer and Mathematical occupations as 3.4% and 37.2%.
How is the Anthropic deck structured from start to finish?
The deck opens with a title slide and a framing slide on AI's uncertain effects (slides 1 and 2), then covers measurement, the privacy-preserving method, and usage concentration by tasks, occupations, states, and countries. A later section on growth and productivity begins on slide 19, and the deck closes with four summary points and a policy quotation on slide 25.
Details
More from Anthropic
- Anthropic investor presentation, IPO roadshow, November 2026 (reconstructed deck and video)
- Anthropic course deck, 2024
- Anthropic pitch deck, 2023
- Anthropic conference talk, 2023
- Anthropic conference talk
All Anthropic decks in the library
Review score: 6 out of 10, Needs substantial work
Presentation quality, judged with the SlideDeck Co review heuristic. Ask, evidence and idea merit are not rated here.
The deck has a clear route from framing to method, usage concentration, business use, and productivity, and slides 6, 7 to 9 and 24 give the audience a real takeaway beside the data. But several slides are unfinished: slides 11, 12 and 13 show raw prompt-like text ('Tighten up section 2...', 'Explain the Baumol effect...', 'Translate this for me') with no headline and no takeaway, and slides 10 to 13 repeat the same chart. Chart text is tiny on slides 4, 16, 21 and 23, labels in the scatter on slide 16 are pale and unreadable, and slide 23 is a dense table with no stated point.
Worth keeping: Keep the slide 6 method diagram, the slides 7 to 9 build that circles one part of the same chart with a one-line claim, and the slide 24 comparison with its highlighted +1.8pp line.
Most useful repair: Remove or replace slides 11 to 13 with a titled slide that states what the automation and augmentation split shows, and add takeaways to slides 16, 21 and 23 with larger, higher-contrast labels.
What would change the score: I would trim the repeated chart on slides 4 and 7 to 9 and 10 to 13 to one build each, and make the scatter and table text readable at the back of a room.
Confidence medium. 26 of 26 pages inspected on contact sheets, 4 at readable size. Reviewed 2026-11-08. Model-assisted review (claude-sonnet-5-5).
Full text of the slides (26 slides)
Every slide's words and a description of its charts and images, so the deck can be searched and rebuilt. Also available as Markdown.
Slide 1
ANTHROP\C
Measuring real-world AI usage and / assessing its economic implications
An Introduction to the Anthropic Economic Index
Peter McCrory
Head of Economics, Anthropic
January 2026
CONFIDENTIAL
1
Slide 2
AI poised to have large but uncertain effects
●
AI is a general purpose technology
Eloundou et al (2023)
●
Adoption has been fast
Humlum & Vestergaard (2024); Bick et al (2025)
●
Capabilities are improving quickly
METR (2025)
●
An innovation in the method of innovation
Bontadini & Haskel (2025); Jones, Jones & Aghion (2017); Jones (2025); Trammell & Korinek (2023)
●
Uncertain effects on productivity and in the labor market
Filippucci et al (2025); Brynjolfsson, Chandar & Chen (2025); Gimbel et al. (2025)
ANTHROP\C
2
Slide 3
We need measurement to keep pace with capabilities
AI can reliably complete tasks
that take humans 1.5 hours;
this task length doubles every 7 months
We need a rich understanding of how AI systems are being used in the real world
The impact of this technology will be shaped by our societal response
ANTHROP\C
Time-horizon of software engineering tasks / different LLMs can complete / a 50% of the time
METR
Task duration (for humans) / where logistic regression of our data / predicts the AI has a 50% 50% chance of succeeding
Train adversarially robust image model
1 hour
Train classifier
Find fact on web
6 min
Count words in passage
36 sec
Answer question
GPT-3
GPT-2
GPT-3.5
GPT-4
Claude 3.5 Sonnet (Old)
Qwen2-72B
Claude / Opus 4.5
4 sec
2020
2021
2022
2023
2024
2025
LLM release date
3
Visuals: One chart, a scatter plot with error bars, produced by METR, shown inside a white rounded-corner box with a thin dark outline. Title: 'Time-horizon of software engineering tasks, different LLMs can complete a 50% of the time'. Y-axis: 'Task duration (for humans)', logarithmic-looking scale with labelled tick values 4 sec, 36 sec, 6 min, 1 hour, with task names printed beside the axis (Answer question, Count words in passage, Find fact on web, Train classifier, Train adversarially robust image model); the axis label says where logistic regression predicts the AI has a 50% chance of succeeding. X-axis: 'LLM release date' from 2020 to 2025 with ticks at each year. Series: green filled dots for named models, grey dots for other models, each with vertical grey error bars; labelled green points include GPT-2 (about 2019, about 4 sec), GPT-3 (about 2020.4, about 30 sec), GPT-3.5 (about 2022.2, about 36 sec), GPT-4 (about 2023.2, about 6 min), Claude 3.5 Sonnet (Old) (about 2024.5, about 1 hour), Claude Opus 4.5 (about late 2025, about 2 hours or more, top right). Labelled grey point Qwen2-72B (about 2024.4, about 5 min). A dashed sage-green trend line rises from bottom-left to upper-right through the points. Gridlines are faint light grey dashed. METR logo (grey stylised dome icon with 'METR' wordmark) at top-right of the chart box.
Slide 4
Claude usage is uneven across tasks and associated jobs / Claude Economy / vs. / U.S. Economy / ANTHROP\C / 4 / Office and Administrative Support / 7.9% / 12.2% / Transportation and Material Moving / 0.3% / 9.1% / Sales and Related / 2.3% / 8.8% / Food Preparation and Serving Related / 0.5% / 8.7% / Management / 4.5% / 6.9% / Business and Financial Operations / 5.9% / 6.6% / Healthcare Practitioners and Technical / 2.6% / 6.1% / Production / 2.9% / 5.8% / Educational Instruction and Library / 5.8% / 9.3% / Healthcare Support / 0.3% / 4.7% / Construction and Extraction / 0.4% / 4.1% / Installation, Maintenance, and Repair / 0.7% / 3.9% / Computer and Mathematical / 3.4% / 37.2% / Building and Grounds Cleaning and Maintenance / 0.1% / 2.9% / Protective Service / 0.4% / 2.3% / Personal Care and Service / 0.5% / 2.0% / Architecture and Engineering / 1.7% / 4.5% / Community and Social Service / 1.6% / 2.1% / Arts, Design, Entertainment, Sports, and Media / 1.4% / 10.3% / Life, Physical, and Social Science / 0.9% / 6.4% / Legal / 0.8% / 0.9% / Farming, Fishing, and Forestry / 0.1% / 0.3% / 0% / 10% / 20% / 30% / 40% / % of Claude conversations / % of U.S. workers
Visuals: Chart: a dumbbell (dot-and-line) chart with horizontal connecting lines, one row per occupation, 22 rows in total, with no chart title inside the image. Y axis: occupational categories listed top to bottom in the order given in the text, right-aligned labels in grey, with small tick marks at the axis line. X axis: percentage of conversations or workers, linear, running from 0% to about 42%, labelled at 0%, 10%, 20%, 30% and 40%, with faint vertical dotted gridlines at each labelled value. Series 1, '% of Claude conversations', is drawn as terracotta/rust (#C6613F approx.) filled dots, each labelled in the same colour at its right or left end. Series 2, '% of U.S. workers', is drawn as dark grey (#5E5D59 approx.) filled dots, each labelled in grey. Values, printed on the chart: Office and Administrative Support Claude 7.9%, US 12.2%; Transportation and Material Moving 0.3%, 9.1%; Sales and Related 2.3%, 8.8%; Food Preparation and Serving Related 0.5%, 8.7%; Management 4.5%, 6.9%; Business and Financial Operations 5.9%, 6.6%; Healthcare Practitioners and Technical 2.6%, 6.1%; Production 2.9%, 5.8%; Educational Instruction and Library Claude 9.3%, US 5.8%; Healthcare Support 0.3%, 4.7%; Construction and Extraction 0.4%, 4.1%; Installation, Maintenance, and Repair 0.7%, 3.9%; Computer and Mathematical Claude 37.2%, US 3.4% (the longest connector, drawn in terracotta across most of the plot); Building and Grounds Cleaning and Maintenance 0.1%, 2.9%; Protective Service 0.4%, 2.3%; Personal Care and Service 0.5%, 2.0%; Architecture and Engineering Claude 4.5%, US 1.7%; Community and Social Service Claude 2.1%, US 1.6%; Arts, Design, Entertainment, Sports, and Media Claude 10.3%, US 1.4%; Life, Physical, and Social Science Claude 6.4%, US 0.9%; Legal Claude 0.9%, US 0.8%; Farming, Fishing, and Forestry Claude 0.1%, US 0.3%. Connector lines are grey where the US value is higher and terracotta where the Claude value is higher. Legend: boxed in the lower-right corner of the plot, white fill with a thin grey border, containing a terracotta dot with the label '% of Claude conversations' above a grey dot with the label '% of U.S. workers'. Photograph or illustration: none. Logos: ANTHROP\C wordmark, bottom-left, grey text.
Slide 5
Anthropic Economic Index
Understanding AI's effects
on the economy
We use a privacy-preserving method to analyze millions
of transcripts from Claude.ai and 1P API traffic
ANTHROP\C
5
Visuals: Illustration inside the title card: three black hand-drawn line-art hands (stylised curled fingers, one at upper left, one at top centre-right, one lower centre) joined by thin white lines to three white dots (filled circles) that form a connected network, placed in the upper-left corner of the card above the title. Title card is a flat sage rounded rectangle with a thin dark outline; no photograph, no chart, no gradient, no shadow, no overlay. Lighting and dimensionality: none, flat vector style.
Slide 6
The Anthropic Economic Index
Privacy preserving analysis of real-world usage data
Conversations
Private
Tasks
Visible to analysts
Occupations
Visible to analysts
User: My game keeps crashing as I only have 8GB of RAM...
Assistant: I can help you optimize your game settings! Let's lower th...
O*NET TASK
Modify software to improve performance and adapt to new hardware
User: Could you look over my blog post about the Golden Gate Bridge?
Assistant: I'd be happy to review your blog post about the Golden...
O*NET TASK
Review and rewrite content for publication approval
User: Can you make sure this blogpost follows Chicago style?
Assistant: I'll help align your blogpost with Chicago style guide...
O*NET TASK
Standardize materials from other writers and staff
Computer & Mathematical
Arts & Media
Education & Library
Office & Administrative
Life, Physical & Social Science
Business & Financial
Other
ANTHROPIC
Sample of 1M conversations from claude.ai (Free & Pro) from Dec. 2024 / Jan. 2025
6
Visuals: Diagram, placed as a single image (1536 by 594 pixels) occupying about x 2 to 99 and y 22 to 89 of the slide, with rounded white panel behind it. Left column 'Conversations' has three rounded rectangles with off-white fill, each containing a User and Assistant exchange in serif text; a grey 'Private' badge with eye-slash icon sits beside the heading. Middle column 'Tasks' has three smaller rounded rectangles with off-white fill, each headed 'O*NET TASK' with a wrench icon and a task statement; a red-outlined 'Visible to analysts' badge with eye icon sits beside the heading. Each conversation box has a grey dot on its right edge connected by a short grey arrow to the matching task box's left edge. Each task box has a grey dot on its right edge: the first task connects by an elbow arrow down to Computer & Mathematical; the second task arrow and the third task arrow merge in a bracket line that points right into Arts & Media. Right column 'Occupations' has a red-outlined 'Visible to analysts' badge and a light grey bordered container holding a treemap: Computer & Mathematical is a large mint-green (#E8F6F0) block with a green code icon and green label (#1E7A55); below it Arts & Media is a cream block (#FBF3E4) with brown label and paintbrush icon, Education & Library is a lavender block (#EEEFFB) with indigo label and graduation cap icon, a narrow vertical 'Other' strip in pale grey at far right; Office & Administrative is a pale pink block (#FBEDEE) with dark red label and building icon; Life, Physical & Social Science is a pale blue block (#EAF2FB) with blue label and flask icon; Business & Financial is a pale peach block (#FBEFEA) with red label and table icon at the bottom right.
Slide 7
Claude usage is uneven across tasks and associated jobs / Office and Administrative Support / 7.9% / 12.2% / Transportation and Material Moving / 0.3% / 9.1% / Sales and Related / 2.3% / 8.8% / Food Preparation and Serving Related / 0.5% / 8.7% / Management / 4.5% / 6.9% / Business and Financial Operations / 5.9% / 6.6% / Healthcare Practitioners and Technical / 2.6% / 6.1% / Production / 2.9% / 5.8% / Educational Instruction and Library / 5.8% / 9.3% / Healthcare Support / 0.3% / 4.7% / Construction and Extraction / 0.4% / 4.1% / Installation, Maintenance, and Repair / 0.7% / 3.9% / Computer and Mathematical / 3.4% / 37.2% / Building and Grounds Cleaning and Maintenance / 0.1% / 2.9% / Protective Service / 0.4% / 2.3% / Personal Care and Service / 0.5% / 2.0% / Architecture and Engineering / 1.7% / 4.5% / Community and Social Service / 1.6% / 2.1% / Arts, Design, Entertainment, Sports, and Media / 1.4% / 10.3% / Life, Physical, and Social Science / 0.9% / 6.4% / Legal / 0.8% / 0.9% / Farming, Fishing, and Forestry / 0.1% / 0.3% / 0% / 10% / 20% / 30% / 40% / % of Claude conversations / % of U.S. workers / Jobs that require moving / objects in the real world / and/or relationships with / people are BIG parts of the / U.S. economy, but show low / Claude usage / ANTHROP\C / 7
Visuals: One dot-and-line (dumbbell) chart, horizontal, with a title-less plot and a categorical y-axis of 22 job categories listed top to bottom in reading order. X-axis: percentage share, 0% to 40% in 10% steps, range about -5% to 42%, tick labels at the bottom (0%, 10%, 20%, 30%, 40%), light vertical gridlines at each tick. Series 1: % of Claude conversations, terracotta/orange dots (about #C8634A). Series 2: % of U.S. workers, dark grey dots (about #6B6B6B), connected by thin grey or orange lines between each pair of dots. Labelled values are printed beside each dot as listed in text. Highlighted points: the first four rows (Office and Administrative Support, Transportation and Material Moving, Sales and Related, Food Preparation and Serving Related) are enclosed by a thick orange rounded rectangle outline (about #D9714F, stroke about 0.5% of slide height). The largest Claude value, Computer and Mathematical at 37.2%, is shown as the long orange line. Legend box bottom-right inside the plot: white fill with thin grey border, containing an orange dot labelled % of Claude conversations and a grey dot labelled % of U.S. workers. The chart plot area has a thin dark grey left and bottom axis line and a grey outline frame at the top and right.
Slide 8
Claude usage is uneven across tasks and associated jobs
Software engineering
corresponds to ~3 % of
the U.S. economy, but
~40% of the Claude
economy
ANTHROP\C
8
Visuals: One chart: a dumbbell (paired dot) chart with horizontal connecting lines, titled 'Claude usage is uneven across tasks and associated jobs' by the slide title. Y axis: 22 occupational categories, listed top to bottom, labelled right-aligned beside the axis. X axis: share in percent, labelled 0%, 10%, 20%, 30%, 40%, range about -5% to 42%, light vertical gridlines at each tick. Series 1, '% of Claude conversations', dark orange-red dots (#C6613F): Office and Administrative Support 7.9%; Transportation and Material Moving 0.3%; Sales and Related 2.3%; Food Preparation and Serving Related 0.5%; Management 4.5%; Business and Financial Operations 5.9%; Healthcare Practitioners and Technical 2.6%; Production 2.9%; Educational Instruction and Library 9.3%; Healthcare Support 0.3%; Construction and Extraction 0.4%; Installation, Maintenance, and Repair 0.7%; Computer and Mathematical 37.2%; Building and Grounds Cleaning and Maintenance 0.1%; Protective Service 0.4%; Personal Care and Service 0.5%; Architecture and Engineering 4.5%; Community and Social Service 2.1%; Arts, Design, Entertainment, Sports, and Media 10.3%; Life, Physical, and Social Science 6.4%; Legal 0.9%; Farming, Fishing, and Forestry 0.1%. Series 2, '% of U.S. workers', dark grey dots (#5E5E5E): Office and Administrative Support 12.2%; Transportation and Material Moving 9.1%; Sales and Related 8.8%; Food Preparation and Serving Related 8.7%; Management 6.9%; Business and Financial Operations 6.6%; Healthcare Practitioners and Technical 6.1%; Production 5.8%; Educational Instruction and Library 5.8%; Healthcare Support 4.7%; Construction and Extraction 4.1%; Installation, Maintenance, and Repair 3.9%; Computer and Mathematical 3.4%; Building and Grounds Cleaning and Maintenance 2.9%; Protective Service 2.3%; Personal Care and Service 2.0%; Architecture and Engineering 1.7%; Community and Social Service 1.6%; Arts, Design, Entertainment, Sports, and Media 1.4%; Life, Physical, and Social Science 0.9%; Legal 0.8%; Farming, Fishing, and Forestry 0.3%. Connecting lines are grey where the workers value is higher and orange-red where the Claude value is higher. Legend in a white box with thin grey border at bottom-right of the plot: red dot '% of Claude conversations', grey dot '% of U.S. workers'. Highlighted point: the Computer and Mathematical row is enclosed by an orange rounded rectangle outline, with its 37.2% Claude point the largest value on the chart. A highlight outline box surrounds that row across the full chart width.
Slide 9
Claude usage is uneven across tasks and associated jobs / Office and Administrative Support / Transportation and Material Moving / Sales and Related / Food Preparation and Serving Related / Management / Business and Financial Operations / Healthcare Practitioners and Technical / Production / Educational Instruction and Library / Healthcare Support / Construction and Extraction / Installation, Maintenance, and Repair / Computer and Mathematical / Building and Grounds Cleaning and Maintenance / Protective Service / Personal Care and Service / Architecture and Engineering / Community and Social Service / Arts, Design, Entertainment, Sports, and Media / Life, Physical, and Social Science / Legal / Farming, Fishing, and Forestry / 0% / 10% / 20% / 30% / 40% / Media/entertainment is overrepresented in the Claude economy / The natural sciences and social sciences are also seeing relatively high Claude usage / % of Claude conversations / % of U.S. workers / ANTHROP\C / 9
Visuals: Chart: horizontal dot-and-line (lollipop/dumbbell) chart, one row per occupation category, 22 rows, top to bottom in the order listed in the text. Each row has a red-orange dot (Claude conversations, % of Claude conversations) and a dark grey dot (U.S. workers, % of U.S. workers), joined by a thin line; the line is grey when the grey dot is to the right and red-orange when the red dot is to the right. Value labels sit beside each dot: red labels for Claude, grey labels for U.S. workers. No chart title. X-axis: percent of conversations/workers, labelled 0%, 10%, 20%, 30%, 40%, plot range about -4% to 42%, faint vertical gridlines at each labelled tick. Y-axis: categorical occupation labels, no units. Series values as printed (Claude %, U.S. workers %): Office and Administrative Support 7.9%, 12.2%; Transportation and Material Moving 0.3%, 9.1%; Sales and Related 2.3%, 8.8%; Food Preparation and Serving Related 0.5%, 8.7%; Management 4.5%, 6.9%; Business and Financial Operations 5.9%, 6.6%; Healthcare Practitioners and Technical 2.6%, 6.1%; Production 2.9%, 5.8%; Educational Instruction and Library 9.3%, 5.8%; Healthcare Support 0.3%, 4.7%; Construction and Extraction 0.4%, 4.1%; Installation, Maintenance, and Repair 0.7%, 3.9%; Computer and Mathematical 37.2%, 3.4%; Building and Grounds Cleaning and Maintenance 0.1%, 2.9%; Protective Service 0.4%, 2.3%; Personal Care and Service 0.5%, 2.0%; Architecture and Engineering 4.5%, 1.7%; Community and Social Service 2.1%, 1.6%; Arts, Design, Entertainment, Sports, and Media 10.3%, 1.4%; Life, Physical, and Social Science 6.4%, 0.9%; Legal 0.8%, 0.9%; Farming, Fishing, and Forestry 0.1%, 0.3%. Legend: boxed bottom-right inside the chart, white with thin grey border, red-orange dot = % of Claude conversations, grey dot = % of U.S. workers. Highlighted points: a thick red-orange rounded-rectangle outline encloses the Arts, Design, Entertainment, Sports, and Media and Life, Physical, and Social Science rows, spanning nearly the full card width. Computer and Mathematical's 37.2% Claude point is the longest bar and is the most extreme value. Photographs/illustrations: none.
Slide 10
We assess how users interact with Claude
Augmentation
Automation
0 / 10% / 20% / 30% / 40% / 50% / 60%
Percentage of Conversations
2.8%
31.3%
23.3%
14.8%
27.8%
Validation / Task iteration / Learning / Feedback loop / Directive
10
Visuals: Chart: horizontal stacked bar chart. Title: none inside the chart; the slide title above serves as the heading. Y-axis: categorical, two categories, Augmentation (top) and Automation (bottom), with a black vertical axis line. X-axis: Percentage of Conversations, linear, 0% to 60%, ticks every 10% (0%, 10%, 20%, 30%, 40%, 50%, 60%), black horizontal axis line with tick marks. Series in the Augmentation bar, left to right: Validation 2.8%, Task iteration 31.3%, Learning 23.3% (bar ends at about 57.4%). Series in the Automation bar, left to right: Feedback loop 14.8%, Directive 27.8% (bar ends at about 42.6%). Value labels are printed inside each segment in white bold text, centred. Legend: rounded-corner box with a light grey (#C8C7BF) 1 px border and white fill, at the lower right of the plot; entries stacked top to bottom: Validation (navy swatch), Task iteration (blue swatch), Learning (light blue swatch), then a gap, Feedback loop (dark indigo swatch), Directive (lavender swatch); each swatch is a small square. No highlighted points. Bars have square ends at the left edge and slightly rounded right ends with a radius of about 4 px.
Slide 11
Tighten up section 2… Now work in this quote…
Augmentation
2.8%
31.3%
23.3%
Automation
14.8%
27.8%
Validation
Task iteration
Learning
Feedback loop
Directive
0
10%
20%
30%
40%
50%
60%
Percentage of Conversations
11
Visuals: Horizontal stacked bar chart, untitled, on a white background. Y-axis categories: Augmentation (top bar) and Automation (bottom bar), in bold sans-serif, right-aligned against the axis. X-axis is titled 'Percentage of Conversations', ranges 0 to 60% with ticks every 10%, unit percent. Augmentation bar segments left to right: Validation 2.8%, Task iteration 31.3%, Learning 23.3%, total about 57.4%. Automation bar segments left to right: Feedback loop 14.8%, Directive 27.8%, total about 42.6%. Segment labels are white centred text inside each segment. Legend in a rounded white box with light grey border at lower right, listing Validation (dark navy), Task iteration (medium blue), Learning (light blue), Feedback loop (dark indigo), Directive (lavender). No highlighted points. Bars have slightly rounded right corners. Axis lines are black, about 2 px thick. Curved black arrow with a small arrowhead, drawn from the annotation text leftward and down to about x 17%, y 18% above the Augmentation bar.
Slide 12
Explain the Baumol effect in the context of AI
Augmentation
2.8%
31.3%
23.3%
Automation
14.8%
27.8%
Validation
Task iteration
Learning
Feedback loop
Directive
0
10%
20%
30%
40%
50%
60%
Percentage of Conversations
12
Visuals: Horizontal stacked bar chart, no chart title. Y-axis categories: Augmentation (top bar) and Automation (bottom bar). X-axis: 'Percentage of Conversations', linear from 0 to 60%, ticks and labels every 10% (0, 10%, 20%, 30%, 40%, 50%, 60%). Augmentation bar, segments left to right: Validation 2.8%, Task iteration 31.3%, Learning 23.3%, total about 57.4%. Automation bar, segments left to right: Feedback loop 14.8%, Directive 27.8%, total about 42.6%. Legend in a box at lower right, top to bottom: Validation (dark navy), Task iteration (medium blue), Learning (light blue), then a gap, Feedback loop (dark indigo), Directive (lavender). No highlighted points. The chart is a raster image (1536 by 841 px) covering the full slide; the arrow and annotation sit within it.
Slide 13
Augmentation / 2.8% / 31.3% / 23.3% / Automation / 14.8% / 27.8% / Validation / Task iteration / Learning / Feedback loop / Directive / 0 / 10% / 20% / 30% / 40% / 50% / 60% / Percentage of Conversations / Translate this for me / 13
Visuals: Chart: horizontal 100% stacked-style bar chart (stacked segments, not normalised) with two bars. X-axis: 'Percentage of Conversations', range 0% to 60%, ticks every 10% (0%, 10%, 20%, 30%, 40%, 50%, 60%), black axis line with tick marks. Y-axis: categories 'Augmentation' (top) and 'Automation' (bottom), black vertical axis line, no tick labels. Augmentation bar, left to right: Validation 2.8% (dark navy #08325A segment, about 0 to 2.8%), Task iteration 31.3% (mid blue #1B68B3 segment, about 2.8 to 34.1%), Learning 23.3% (light blue #5A9EE3 segment, about 34.1 to 57.4%, rounded right end). Automation bar, left to right: Feedback loop 14.8% (dark indigo #393180 segment, about 0 to 14.8%), Directive 27.8% (lavender-violet #8479E2 segment, about 14.8 to 42.6%, rounded right end). Segment values are printed in white bold centred labels inside each segment. Legend: boxed at the right of the plot, white fill with light grey #C8C8C4 1px rounded border, entries top to bottom: Validation (#08325A), Task iteration (#1B68B3), Learning (#5A9EE3), then a gap, Feedback loop (#393180), Directive (#8479E2), each with a small filled square swatch. Annotation: a thin black curved arrow starts beneath the 'Translate this for me' text and curves up-left to point at the right end of the Automation bar near 43%. No highlighted points beyond the arrow.
Slide 14
Claude use is geographically concentrated in the US
Anthropic AI Usage
Index (AUI)
A measure of whether AI is
over- or underrepresented
in a state given its working
age population.
Top states:
1. DC
3.8
2. Utah
3.8
3. California
2.1
4. New York
1.6
5. Virginia
1.6
Usage Index
Understand if a state uses
Claude more (>1) or less (<1)
than expected, based on its
population.
Leading (top 25%)
Upper middle (50-75%)
Lower middle (25-50%)
Emerging (bottom 25%)
Augmentation vs.
automation
See how people prefer to work
with Claude—collaborating
together or fully delegating
tasks.
Top industries
Track which jobs are using
Claude the most.
AK WI VT ME NH WA ID MT ND MN IL MI NY MA OR NV WY SD IA IN OH PA NJ CT RI CA UT CO NE MO KY WV VA DC MD DE AZ NM KS AR TN NC SC OK LA MS AL GA HI TX FL
Explore the map to see how people are using AI in each state
Our interactive dashboard at anthropic.com/economic-index
ANTHROP\C
14
Visuals: One illustration: a US-state tile-grid map (tile map, not geographic shapes) inside an off-white rounded panel, placed as a single image of 1536 by 788 pixels filling the panel. Each state is a square tile labelled with its two-letter postal code in bold black sans-serif capitals, filled with one of four teal-green shades by Usage Index tier: dark teal #3B8B74 for Leading (top 25%), medium teal #5FB394 for Upper middle (50-75%), light mint #8DD0B6 for Lower middle (25-50%), and very pale mint #BDE3D2 for Emerging (bottom 25%). Tile positions: row 1 AK (far left), WI (centre-right), VT and ME and NH (far right, top two rows); row 2 WA, ID, MT, ND, MN, IL, MI, NY, MA; row 3 OR, NV, WY, SD, IA, IN, OH, PA, NJ, CT, RI; row 4 CA, UT, CO, NE, MO, KY, WV, VA, DC, MD, DE; row 5 AZ, NM, KS, AR, TN, NC, SC; row 6 OK, LA, MS, AL, GA; row 7 HI (far left), TX, FL. Tile shading as read from the image: WA, OR, CA, NV, UT, CO, MO, VA, NY, MA, VT, DC, MD, GA, NC, NJ, CT are darker tiles; the rest lighter. Left of the map, three stacked rounded legend cards with thin light-grey outlines: the top white card titled Usage Index with the explanation and four legend swatches (filled dots in the four teal shades with labels as above); the middle card (greyed title and text, translucent-looking) titled Augmentation vs. automation; the bottom card (greyed title) titled Top industries. Beneath the map, a small grey caption with a tiny hand icon reads Explore the map to see how people are using AI in each state. Lighting is flat; no photograph, no shadows. The map is not cropped and fills the panel with generous padding.
Slide 15
Claude use is also concentrated globally
Anthropic AI Usage
Index (AUI)
A measure of whether AI is
over- or underrepresented
in a country given its
working age population.
Top Countries:
1. Israel
7.0
2. Singapore
4.6
3. Australia
4.1
4. New Zealand
4.1
5. South Korea
3.7
Usage Index
Understand if a country uses
Claude more (>1) or less (<1)
than expected, based on its
population.
Leading (top 25%)
Upper middle (50-75%)
Lower middle (25-50%)
Emerging (bottom 25%)
Minimal
ANTHROP\C
15
Visuals: A choropleth world map (equirectangular projection, full map panel width, Greenland at top centre-left, Australia and New Zealand at lower right, South America at lower centre-left) with countries shaded in five green tiers of the Usage Index: Leading (top 25%) dark teal green #3A917A-style for United States, Canada, Alaska, Scandinavia, Western Europe including Germany, France, Spain, Italy partially, Japan, Australia, and Brazil shown in a mid-tier green; Upper middle (50-75%) mid green for Ireland, UK, Eastern Europe, Mexico, Saudi Arabia area, Thailand, Kazakhstan, Mongolia area; Lower middle (25-50%) lighter green for much of Africa, Brazil-adjacent South America, Southeast Asia, Russia-adjacent Central Asia; Emerging (bottom 25%) pale green for India, parts of South America and Greenland-adjacent areas; Minimal very pale green-grey for Greenland. Countries without data are light grey #E0DFDA including Russia, China, Central Asia, parts of Africa and Middle East. Map has thin white country borders on a cream #F7F6F0 ocean. Legend box: white rounded rectangle with title 'Usage Index' and a description, and five circular colour swatches with labels in the order listed. Top-five ranking is presented as text only with no chart.
Slide 16
Income is a key predictor of usage
Income and Anthropic AUI by country
Income and Anthropic AUI by US state
Left chart: β = 0.690 (p < 0.001) / R² = 0.709; legend: Power law: AUI ≈ GDP^0.69; x-axis: ln(GDP per working-age capita in USD); y-axis: ln(Anthropic AI Usage Index); colour bar ticks 1, 0, −1, −2, −3; x ticks 7, 8, 9, 10, 11, 12; y ticks 2, 1, 0, −1, −2, −3. Country labels include: ISR, KOR, AUS, SGP, USA, NZL, EST, MLT, CAN, GBR, MLD, CHE, LUX, DNK, NOR, IRL, SWE, TWN, LTU, LVA, CYP, PRT, FRA, DEU, NLD, JPN, POL, ESP, ITA, AUT, GEO, MNE, ARM, SRB, BGR, HRV, MUS, MDA, CZE, ARE, CHL, PRI, QAT, MKD, ROU, SVK, HUN, PAN, LKA, UKR, THA, COL, PER, BRA, ALB, ARG, TUR, BHR, MAR, LBN, VNM, MEX, KAZ, SAU, KWT, OMN, BOL, PHL, JOR, ZAF, SLV, IRQ, GTM, IDN, DOM, BLR, DZA, AZE, EGY, HND, CIV, ZWE, BGD, UZB, NPL, KEN, GHA, RWA, NGA, SEN, PAK, BEN, ETH, KHM, MDG, MOZ, ZMB, UGA, BFA, TZA, AGO, TUN, KGZ, CMR. Right chart: β = 1.768 (p < 0.001) / R² = 0.396; legend: Power law: AUI ≈ GDP^1.77; x-axis: ln(GDP per working-age capita in USD); y-axis: ln(Anthropic AI Usage Index); colour bar ticks 1.0, 0.5, 0.0, −0.5, −1.0, −1.5; x ticks 11.4, 11.6, 11.8, 12.0, 12.2, 12.4, 12.6, 12.8; y ticks 1.5, 1.0, 0.5, 0.0, −0.5, −1.0, −1.5. State labels include: UT, DC, CA, VA, NY, CO, WA, MA, VT, NV, OR, MO, MD, IL, NH, NJ, CT, DE, RI, ME, GA, NC, AR, FL, TX, PA, TN, KS, WI, IN, IA, OH, ID, SC, AL, LA, MS, WV, OK, KY, NE, WY, ND, AK, SD, MI, MN, AZ, NM.
ANTHROP\C
16
Visuals: Two scatter plots with fitted dashed power-law trend lines, each with text labels for points rather than markers. Left chart, Income and Anthropic AUI by country: x-axis ln(GDP per working-age capita in USD) from about 6.8 to 12.4; y-axis ln(Anthropic AI Usage Index) from about −3.4 to 2.2; points are three-letter country codes in orange, with color varying from pale beige (low) to deep orange-red (high) on a vertical colour bar labelled 1, 0, −1, −2, −3. Dashed grey trend line runs from about (6.9, −2.3) to (12.2, 1.4); legend top-right reads 'Power law: AUI ≈ GDP^0.69'; stats box top-left reads β = 0.690 (p < 0.001), R² = 0.709. Highest points: ISR at about (11.4, 1.8), SGP at about (11.7, 1.5), USA at about (11.7, 1.3); lowest: TZA at about (7.6, −3.2), AGO at about (8.7, −3.1). Right chart, Income and Anthropic AUI by US state: x-axis ln(GDP per working-age capita in USD) from about 11.3 to 12.9; y-axis ln(Anthropic AI Usage Index) from about −1.6 to 1.6; two-letter state codes in orange with colour from pale beige to deep orange-red on a vertical colour bar labelled 1.0, 0.5, 0.0, −0.5, −1.0, −1.5. Dashed grey trend line runs from about (11.35, −1.1) to (12.85, 1.5); legend top-right reads 'Power law: AUI ≈ GDP^1.77'; stats box top-left reads β = 1.768 (p < 0.001), R² = 0.396. Highlighted points: DC at about (12.83, 1.35) and UT at about (11.78, 1.35) in deeper orange-red; CA at about (11.97, 0.75). Lowest: MS at about (11.33, −1.55), WV at about (11.49, −1.4). No values are printed for individual points beyond the codes and axis ticks. Both charts have light grey gridlines, thin dark grey axis frames, and no markers; charts are boxed with thin grey outlines and are not cropped.
Slide 17
Businesses use Claude in similar but distinctive ways
Usage shares across top occupational categories
Computer & mathematical
44%
36%
Office & administrative support
10%
8%
Educational instruction & library
4%
12%
Life, physical & social science
7%
7%
Art, design, entertainment, sports & media
5%
8%
Business & financial operations
3%
3%
Sales and related
4%
2%
Management
3%
3%
0 10 20 30 40 50
Percentage of usage
1P API
Claude.ai
API customers
More coding tasks +8%pp
Less educational tasks -8%pp
ANTHROP\C
17
Visuals: A horizontal grouped bar chart titled 'Usage shares across top occupational categories'. The x-axis is labelled 'Percentage of usage' and runs from 0 to 50 with tick labels every 10 (0, 10, 20, 30, 40, 50), with faint vertical gridlines at each tick. The y-axis lists eight occupational categories top to bottom with no axis title. Each category has two bars, a coral 1P API bar and a light blue Claude.ai bar, with value labels at the bar ends. Values for 1P API: Computer & mathematical 44%, Office & administrative support 10%, Educational instruction & library 4%, Life, physical & social science 7%, Art, design, entertainment, sports & media 5%, Business & financial operations 3%, Sales and related 4%, Management 3%. Values for Claude.ai: Computer & mathematical 36%, Office & administrative support 8%, Educational instruction & library 12%, Life, physical & social science 7%, Art, design, entertainment, sports & media 8%, Business & financial operations 3%, Sales and related 2%, Management 3%. Legend box at upper right of the chart with a white fill, thin grey rounded border, a coral swatch labelled 1P API and a light blue swatch labelled Claude.ai. No points are highlighted. The bars have rounded ends. Coral 1P API is about #E57B6B and light blue Claude.ai is about #A4C2E0. A callout box at lower right is a rounded rectangle in warm beige #E8E6DC with a title 'API customers', a thin grey rule beneath it, and two rows: 'More coding tasks' with '+8%pp' and 'Less educational tasks' with '-8%pp' right-aligned in italic serif.
Slide 18
Firms use Claude to automate tasks
Augmentation
Automation
80
70
60
50
40
30
20
10
0
Validation
Learning
Task iteration
4.5%
20.3%
22.2%
3.1%
3.8%
5.5%
Claude.ai
vs.
API
Feedback loop
Directive
10.3%
38.8%
11.1%
66.3%
Claude.ai
vs.
API
ANTHROP\C
18
Visuals: Two stacked column charts placed side by side, titled 'Augmentation' (left) and 'Automation' (right). Both share a vertical axis with ticks labelled 0 to 80 in steps of 10, no axis title or unit printed, drawn as a thin dark grey vertical line on the left of the left panel and gridlines in very pale grey at each tick. Each panel has two categories along the horizontal axis, 'Claude.ai' and 'vs.' and 'API' printed under the bars, with the 'vs.' label between the two bars. Augmentation series (bottom to top, stacked): Task iteration (#A8B8E0 blue, labelled 22.2% for Claude.ai, about 22 on the axis, and 5.5% for API, about 6 on the axis), Learning (#BCD4EE light blue, labelled 20.3% for Claude.ai, about 20 units tall, and 3.8% for API, about 4 units tall), Validation (#8F9EB3 slate grey, labelled 4.5% for Claude.ai, about 5 units tall, and 3.1% for API, about 3 units tall). Claude.ai augmentation total is about 47 on the axis; API total is about 12.5 on the axis. Automation series (bottom to top, stacked): Directive (#C4B5D6 lavender, labelled 38.8% for Claude.ai, about 39 units tall, and 66.3% for API, about 66 units tall) and Feedback loop (#9C7FA8 mauve, labelled 10.3% for Claude.ai, about 10 units tall, and 11.1% for API, about 11 units tall). Claude.ai automation total is about 49 on the axis; API total is about 77 on the axis. Value labels sit immediately to the right of each segment in dark grey sans-serif. Legends: a rounded rectangle with a 1px dark grey outline and white fill in the top left of each panel, containing three rows of colour swatch and label for Augmentation (Validation, Learning, Task iteration) and two rows for Automation (Feedback loop, Directive). No highlighted points. No photographs, logos or icons other than the wordmark.
Slide 19
What might AI mean / for growth & / productivity? / ANTHROP\C / 19
Slide 20
Will AI reverse the productivity slowdown?
●
AI productivity gains have policy
implications:
○
Economic forecasts (GDP growth,
inflation, interest rates)
○
Tax revenue and labor market
dynamics
●
Lab studies have strong internal
validity but are narrow
●
The Economic Index currently
captures breadth of usage across
tasks, but not the time savings of
that usage
ANTHROP\C
%oya in Labor Productivity in Nonfarm Business Sector, 15-year moving average
Source: BLS, FRED
20
Visuals: One line chart in a rounded rectangle with a thin light-grey border. Title printed at top-left of chart: '%oya in Labor Productivity in Nonfarm Business Sector, 15-year moving average'. Y-axis: 0.0 to 3.5 in steps of 0.5, unitless percent-year-over-year values, with light horizontal gridlines. X-axis: years 1962 to about 2024, labelled every five years (1962, 1967, 1972, 1977, 1982, 1987, 1992, 1997, 2002, 2007, 2012, 2017, 2022). Single series drawn as a thick blue line (about #3A96D3) with rounded joins. Values are not printed, so these are estimates: about 2.8 in 1962, peak about 2.9 in 1964, about 2.5 around 1970, peak about 2.9 in 1973, about 2.7 in 1976, falling to about 1.6 by 1982, trough about 1.4 around 1990, rising to about 2.5 in 2003, peak about 2.7 around 2010, falling to about 1.5 by 2019, about 1.8 in 2021, ending about 1.45 in 2024. No legend and no highlighted points. Source note 'Source: BLS, FRED' sits bottom-right inside the chart box.
Slide 21
We use Claude to estimate / how long it would take to do / real-world tasks with and / without AI assistance / This generates implied time savings across a / range of tasks that people ask Claude to handle / Claude, given the following / transcript: / User: Given this source / material, can you write a / memo? [...] / Assistant: here it is [...] / Can you estimate how many / hours it would take a human to / do the work in that transcript? / Output just a number. / 1.5 / ANTHROP\C / Sample of 100k conversations from claude.ai (Free & Pro) from Sep. 2025 / 21 / Checking / diagnostic / images / Troubleshooting / office / equipment / Writing or / updating computer / programs / Compiling / information / from reports / Density / 0.08 / 0.06 / 0.04 / 0.02 / 0.00 / 20 / 40 / 60 / 80 / 100 / Time savings (%)
Visuals: Left: a grey user-avatar outline icon (circle with head and shoulders) at top-left of the transcript box. A rounded rectangle box, beige-grey fill #F0EEE6 with a dark grey #6B6A65 outline about 0.3% of width, contains the text 'Claude, given the following transcript:' followed by a nested white rounded box with a document-icon tab at its top-left corner containing 'User: Given this source material, can you write a memo? [...]' and 'Assistant: here it is [...]', then the question 'Can you estimate how many hours it would take a human to do the work in that transcript? Output just a number.' Below the box, a grey outline robot icon and a rounded rectangle badge with '1.5' in dark grey. Right: an area chart titled none, filled in steel blue #6A9BCC with no outline, sitting on a white plot area. Y axis labelled 'Density' from 0.00 to 0.08 with gridlines at 0.02 intervals, ticks labelled 0.00, 0.02, 0.04, 0.06, 0.08. X axis labelled 'Time savings (%)' with ticks 20, 40, 60, 80, 100. The density curve is near zero from 10 to about 45, rises in a jagged way from about 45 to about 70 (peaks near 0.015 around 65), then climbs to about 0.023 near 71, about 0.028 near 74, and about 0.053 near 85, peaking at about 0.062 near 88, then declining to near 0.004 at about 96 where it ends. Four callout boxes with thin dark grey #6B6A65 outlines and rounded corners, each with a downward arrow line: 'Checking diagnostic images' with arrow to about x=20 at the baseline; 'Troubleshooting office equipment' with arrow to about x=51 near the baseline; 'Writing or updating computer programs' with arrow to about x=80 at about density 0.032; 'Compiling information from reports' with arrow to about x=96 at about density 0.016.
Slide 22
Task duration estimates without AI correlates with
occupational wage of associated tasks
2.00
Management
Legal
1.75
Education
Arts & entertainment
Business & financial
1.50
Science
Computer & mathematical
1.25
Architecture & engineering
Construction
Community & social service
1.00
Production
Healthcare practitioners
0.75
Personal care
Office & administration
Sales
0.50
Farming
Food preparation
Maintenance & repair
Transportation
Protective service
0.25
20
30
40
50
60
70
Average hourly wage ($/hour)
Time without AI (hours)
r = 0.799
R² = 0.638
n = 22
ANTHROP\C
22
Visuals: One scatter plot with a dashed linear trend line, placed as a single image. Type: scatter plot with labelled points and a dashed trend line. No chart title. Y axis: 'Time without AI (hours)', range about 0.25 to 2.00, ticks every 0.25 (0.25, 0.50, 0.75, 1.00, 1.25, 1.50, 1.75, 2.00). X axis: 'Average hourly wage ($/hour)', range about 15 to 73, ticks every 10 (20, 30, 40, 50, 60, 70). Series: one series of 22 occupational points, each labelled with its occupation. Estimated values (about): Management about (68, 1.95); Legal about (66, 1.80); Education about (31.5, 1.65); Arts & entertainment about (36.5, 1.58); Business & financial about (44.8, 1.52); Science about (43, 1.46); Computer & mathematical about (56, 1.45); Architecture & engineering about (50, 1.28); Construction about (31, 1.13); Community & social service about (30.3, 1.08); Production about (24, 0.92); Healthcare practitioners about (50.6, 0.86); Office & administration about (24, 0.67); Personal care about (18.8, 0.56), with a tight cluster of two or three points near (19, 0.55); Sales about (26, 0.51); Farming about (20, 0.50); Food preparation about (17.3, 0.45); Maintenance & repair about (29.5, 0.45); Transportation about (23.4, 0.31); Protective service about (29.2, 0.30). Points are filled blue circles, about 1.2% of slide width in diameter. Dashed grey trend line runs from about (18, 0.52) up to about (68.5, 1.90). Legend: no legend; a rounded callout box in the lower right of the plot lists r = 0.799, R² = 0.638, n = 22. No points are highlighted differently.
Slide 23
Labor productivity contribution by occupation / Occupation | Employment | Wage bill | Wage bill share | ln (time est. ratio) | Annual labor prod contrib. / Overall economy | 154.1M | $10.46T | 100.00% | 0.196 | 1.80% / Software developers | 1.65M | $239.18B | 2.3% | 1.507 | 0.34% / General and operation managers | 3.58M | $477.16B | 4.6% | 0.224 | 0.10% / Market research analysts and marketing specialists | 0.86M | $74.47B | 0.7% | 1.271 | 0.09% / Secondary school teachers, except special and career/technical education | 1.07M | $79.05B | 0.8% | 0.820 | 0.06% / Lawyers | 0.75M | $136.66B | 1.3% | 0.451 | 0.06% / Customer service representatives | 2.73M | $123.70B | 1.2% | 0.431 | 0.05% / Retail salespersons | 3.80M | $141.18B | 1.3% | 0.360 | 0.05% / Computer and information systems managers | 0.65M | $121.44B | 1.2% | 0.379 | 0.04% / Marketing managers | 0.38M | $66.03B | 0.6% | 0.697 | 0.04% / Elementary school teachers, except special | 1.39M | $97.24B | 0.9% | 0.384 | 0.04% / ANTHROP\C / 23
Visuals: Table with six columns: Occupation; Employment (millions of workers, M); Wage bill (billions or trillions of dollars, B or T); Wage bill share (percent); ln (time est. ratio) (unitless); Annual labor prod contrib. (percent). Rows: Overall economy 154.1M, $10.46T, 100.00%, 0.196, 1.80%. Software developers 1.65M, $239.18B, 2.3%, 1.507, 0.34%. General and operation managers 3.58M, $477.16B, 4.6%, 0.224, 0.10%. Market research analysts and marketing specialists 0.86M, $74.47B, 0.7%, 1.271, 0.09%. Secondary school teachers, except special and career/technical education 1.07M, $79.05B, 0.8%, 0.820, 0.06%. Lawyers 0.75M, $136.66B, 1.3%, 0.451, 0.06%. Customer service representatives 2.73M, $123.70B, 1.2%, 0.431, 0.05%. Retail salespersons 3.80M, $141.18B, 1.3%, 0.360, 0.05%. Computer and information systems managers 0.65M, $121.44B, 1.2%, 0.379, 0.04%. Marketing managers 0.38M, $66.03B, 0.6%, 0.697, 0.04%. Elementary school teachers, except special 1.39M, $97.24B, 0.9%, 0.384, 0.04%. Each Employment and Wage bill value has a filled dot beside it: blue dots (about #3B9ADB) for Employment and purple dots (about #8B6FE8) for Wage bill, sized in proportion to the value, from small (Marketing managers 0.38M, Market research analysts 0.86M) to large (Retail salespersons 3.80M, General and operation managers 3.58M and $477.16B). Each annual labor productivity value has a yellow dot (about #F5B300) sized in proportion, largest for Software developers 0.34%, smallest for 0.04% rows. No chart, no highlighted points, no legend and no photographs or icons. A thin dark grey rule (about #5E5D59) separates the header row from the Overall economy row, and thin light grey rules (about #E4E1DA) separate the other rows.
Slide 24
Implied labor productivity gain is on upper end of estimates
Predicted increase in annual labor productivity growth / over a 10-year horizon due to AI
Range of estimates
3.5
3
2.5
2
1.8
1.5
1
0.50
0.25
Percentage points
Increase in labor productivity implied by / Claude’s task-duration estimates:
+1.8%pp
Baily, Brynjolfsson / and Korinek / (2023, USA)
McKinsey / (2023, Global)
Goldman Sachs / (2023, USA)
IMF / (2024, UK)
AI Commission / of France / (2024, FRA)
Aghion and / Bunel / (2024, USA)
Bereaud / (2024, EA)
Acemoglu / (2024, USA)
ANTHROP\C
24
SOURCE: Francesco Filippucci, Peter Gal, and Matthias Schief (2024) “Miracle or Myth? Assessing the / macroeconomic productivity gains from Artificial Intelligence”, OECD Publishing
Visuals: Vertical bar chart with a hatched range overlay, titled 'Predicted increase in annual labor productivity growth over a 10-year horizon due to AI'. Y-axis labelled 'Percentage points' on a non-linear (log-like) scale with ticks at 0.25, 0.50, 1, 1.5, 1.8, 2, 2.5, 3 and 3.5. X-axis categories are estimate sources. Series values are not printed, so estimates are about: Baily, Brynjolfsson and Korinek (2023, USA) solid bar about 2.6; McKinsey (2023, Global) solid bar about 0.55 with hatched range from about 0.55 to about 3.4; Goldman Sachs (2023, USA) solid bar about 1.5; IMF (2024, UK) solid bar about 0.9 with hatched range from about 0.9 to about 1.5; AI Commission of France (2024, FRA) solid bar about 1.35; Aghion and Bunel (2024, USA) solid bar about 1.05; Bereaud (2024, EA) solid bar about 0.45; Acemoglu (2024, USA) solid bar about 0.28. Solid bars are mid-blue #6A9BCC with rounded top corners. Hatched ranges are light blue #DDEEF9 fill with blue #6A9BCC diagonal hatch and blue outline. A grey dashed horizontal reference line sits at 1.8 across the plot. Legend at top right: a box with a hatched blue swatch and the label 'Range of estimates'. Highlighted annotation in terracotta #CC785C: text 'Increase in labor productivity implied by Claude’s task-duration estimates:' with a dashed terracotta arrow pointing down-right to the label '+1.8%pp' placed on the 1.8 reference line. No logos other than the ANTHROP\C wordmark.
Slide 25
Concluding remarks
● Existing AI capabilities already set to transform the economy
● Early AI adoption is strikingly uneven
● AI automation may bring both productivity & job displacement
● Adoption and impact of new technology is not predetermined
“Ultimately, the economic effects of transformative
AI will be shaped as much by technical capabilities
as by the policy choices societies make.”
ANTHROP\C
25
Visuals: None. The slide contains no photographs, charts, diagrams or icons. The only non-text mark is the solid black round bullet glyph (●) before each of the four bullet items.
Slide 26
AI / 26
Visuals: One logo: an 'AI' wordmark in a bold geometric sans. The 'A' is a solid off-white letterform with a triangular counter and a flat horizontal crossbar, with its legs cut flat at the baseline. The 'I' is a slanted parallelogram bar leaning right, set immediately to the right of the 'A' with a small gap. Both are filled #FAFAF8 on the #141413 background. No photographs, charts, or other graphics appear.
Download this deck
The hosted PDF of every library deck is free for readers of the SlideDeck Co newsletter. Join with your email and the viewer and download appear here.
Building a deck of your own? The SlideDeck Co Standard Deck is a slide library for business presentations: reviews, updates and plans.







