The deck opens with a tweet from a developer praising Vercel and Next.js, then frames a problem: frontend teams are slowed by disjointed development processes, difficult production infrastructure, and repeated regressions that stop teams reusing past work. It then presents Vercel as the solution, introduces Next.js with adoption figures, and describes the platform in three parts: production infrastructure, an intelligent edge network, and cross-functional collaboration. A slide on the Develop, Preview and Ship workflow walks through an example deploy preview reviewed by engineering, design and marketing teams. The closing section shows enterprise go-to-market traction and charts of paid product usage and Next.js adoption, with month-over-month growth figures. Several slides are short, one-line statements that carry the argument, and the charts are used to back the growth story.
Full text of the slides (20 slides)
Every slide's words and a description of its charts and images, so the deck can be searched and rebuilt. Also available as Markdown.
Slide 1
Vercel / Develop. / Preview. / Ship.
Visuals: One logo: a solid black upward-pointing triangle followed by the wordmark 'Vercel' in a bold geometric sans-serif, both in black. No photographs, charts or illustrations. A faint light-grey band runs along the top edge of the slide.
Slide 2
Paul Graham / @paulg / This is why startups grow. They make something customers love so much that they spontaneously recommend it. It's the only way to get exponential growth. / twitter.com/ericcobbson/s... / Eric Eriksson @ericeriksson · Feb 4 / damn @vercel I can't recommend you strongly enough. Next.js is down-right magical and Next.js just makes so much sense. Thank you for removing so much of the mind-numbing struggle that comes with React. / 1:42 AM · Feb 6, 2020 · Twitter Web App / 157 Retweets / 13 Quote Tweets / 887 Likes
Visuals: A screenshot-style tweet mockup, not a chart. Elements: a circular profile photograph of Paul Graham (a man with short hair and a dark background, head-and-shoulders, cropped to a circle about 4% of slide width) at top left of the card; a small blue verified badge beside the name; a small grey overflow menu icon at top right; a blue hyperlink (twitter.com link, truncated with an ellipsis) below the tweet body; an embedded quoted-tweet box with a near-black rounded rectangle (about #1C232B) containing a tiny white-grey avatar icon, the quoted author name and handle in grey, and three lines of white body text; a thin grey horizontal divider line above and below the stats row. The image is low resolution and slightly blurred; the small grey metadata text is hard to read.
Slide 3
The web is in jeopardy.
Slide 4
Disjointed Frontend Development Process
Shipping new content is held back:
Stakeholders unable to provide input until late
in development process
Lack of collaboration automation
Blocked by waiting for infrastructure
Difficult to to ship new projects, experiments,
micro-sites, and one-off campaigns
Onboarding contractors and new developers
is time-sink
Visuals: One decorative segmented donut ring with no chart axes, values or legend. It has three visible shaded segments: an upper-left segment in lighter red about #E23B2E, an upper-right segment in slightly darker red about #D9352A, and a lower segment in darkest red about #B3271E. The segments meet at roughly 12 o clock and at the lower-left and lower-right, and the centre is a white hole about 41% of the ring diameter. The ring is flat with no shadow or gradient. A thin dark grey diagonal line (about #333333, roughly 1 px) runs from the upper-left of the title area down-right to the upper-left edge of the ring. Five small red ring-with-dot bullet icons (about #D9534F outline, roughly 1.2% of the width each) sit at the left of the five bullet items.
Slide 5
Difficulties in Production
Customers have poor experience:
Significant engineering effort to manage unnecessarily complex global infrastructure (opportunity cost)
Development environments don't reflect production network behavior leading to 404s
Visitors get stale content
Poor page performance leading to poor SEO and high bounce rates
Costly infrastructure
Visuals: One donut chart, centred at about x 50%, y 35% of the slide, about 17.5% wide and 32% tall. It has three equal-looking slices with no labels, values, axes or legend: the right slice (12 to 4 o'clock) is mid red, the bottom slice (4 to 8 o'clock) is darker red, and the left slice (8 to 12 o'clock) is bright red. The hole is white with a radius of about 40% of the outer radius. A thin dark grey leader line runs from the upper right of the donut to the upper right, ending at the text column, with no label. Seven small red-outlined circle-dot bullet icons precede the list items.
Slide 6
...are not learning from prior work
Regressions are frequent:
Unable to find and reuse prior work
Lack of insight into performance degradation before users or
SEO reputation is affected
Visuals: One donut chart centred at about x 50%, y 28%, roughly 17.5% of slide width and 31% of slide height. It is divided into three red wedges with no labels, values, title, axes or legend: the upper-right wedge is a lighter red (about #E23B2E), the left wedge is a slightly different red (about #E8402F), and the bottom wedge is a darker red (about #B82A1E). The centre hole is white and about half the outer diameter. Below it is a thin dark grey vertical line (about #555555, roughly 0.2% of width) centred at x 50%, running from about y 47% to y 59%. Two small circled-x bullet icons, outlined in red-orange (about #E0503A), sit to the left of the two bullet lines.
Slide 7
The Solution
Visuals: One solid black upward-pointing isosceles triangle, centred horizontally, about 4% of slide width and 6% of slide height, with no outline and no shadow. It sits above the title with a gap of roughly 30% of slide height between them. No photographs, charts or other graphics.
Slide 8
NEXT.JS / Vercel
Visuals: Logos and a separator. Left: the Next.js logo, a thin black geometric wordmark reading NEXT with a small '.JS' suffix at its lower right, with a thin diagonal stroke through the N and X. Centre: a single thin light-grey diagonal line (forward slash) running from upper right to lower left. Right: the Vercel logo, a solid black upward-pointing triangle followed by the bold black lowercase wordmark 'Vercel'. No photographs, charts or tables.
Slide 9
Next.js is growing fast.
Downloads in past 2 Years
legend: gatsby / next / create-react-app
ticketsnap monday elastic NATIONAL CLOUDBANK trulia Tencent
11 of the
AlexaRank 100
75 of the
AlexaRank 1,000
493 of the
AlexaRank 10,000
open collective hulu bethesda
Nike ERRANCE Unsplash STAPLES Jet ticketmaster
Visuals: Line chart titled 'Downloads in past 2 Years' with a dropdown-style selector reading '2 Years'. Three series: a blue line (gatsby), an orange line (next) and a green line (create-react-app), all unlabelled on the axes and with blurred tick labels that cannot be read. The orange line rises from roughly 100,000 in early 2018 to a peak near 800,000 at the right edge, the blue line rises to about 450,000, and the green line stays low, about 100,000 to 150,000. A faint vertical reference line marks the start of the 2019 region, and the chart has light horizontal gridlines. Behind the text is a faded logo wall in light grey: ticketsnap, monday, elastic, NATIONAL CLOUDBANK, an unidentified logo, trulia, Tencent, open collective, hulu, an unidentified logo, bethesda, Nike, ERRANCE, Unsplash, STAPLES, Jet, a diamond-shaped logo and ticketmaster.
Slide 10
Vercel Inc. / @Vercel / NEXT / CONF / OCTOBER 27, 2020 / ONLINE / Hosted by Vercel / nextjs.org/conf / No 000001 / In 24 hours, Next.js Conf had over 16,000 registrants / It currently has 80,000... / Speakers / [speaker names and role captions in the portrait grid are too small to read at this resolution]
Visuals: Ticket graphic: a black rectangular ticket with a thin rainbow gradient outline (red-orange at top left, yellow and green across the top, blue at right) and semicircular notches cut into the left and right edges at mid-height. Inside, at top left, a white filled circle holds a black upward-pointing triangle, the Vercel logo, next to the wordmark Vercel Inc. and the handle @Vercel. At lower left, the NEXT wordmark is set in thin white outline capitals with a small slash through the X, followed by a tiny Conf label and a row of three small coloured dots (pink, yellow, teal). Dates and place are printed to the right of this in white capitals. Along the bottom edge are the small lines Hosted by Vercel and nextjs.org/conf. A vertical white number, No 000001, runs down the right side of the ticket. Below the white band, the portrait grid: about 60 small black-and-white head-and-shoulders photographs in three rows of about 20 cards each, mostly against plain or softly lit grey and white backgrounds, with heads at similar scale and framing. Each card has a black caption strip beneath with a tiny illegible name and role line in light grey. Lighting is even and studio-like. No overlay or tint is visible on the portraits.
Slide 11
What is Vercel? / Production Infrastructure / Intelligent Edge Network / Cross-Functional Collaboration
Visuals: Diagram: three flat parallelogram slabs stacked in a staircase, back to front. (1) Top, light blue #74BDF7 slab labelled 'Production Infrastructure', spanning roughly x 43-81%, y 17-44%. (2) Middle, salmon-pink #F4A09A slab labelled 'Intelligent Edge Network', spanning roughly x 49-87%, y 34-60%, overlapping the lower-right part of the blue slab and covering it. (3) Bottom, dark green #356F1E slab labelled 'Cross-Functional Collaboration', spanning roughly x 55-93%, y 50-76%, overlapping the lower-right part of the pink slab. Each slab has a slanted left and right edge with the same skew angle, horizontal top and bottom edges, and no outline, shadow, or gradient. The labels are white and centred horizontally on each slab. No arrows or connectors.
Slide 12
What is Vercel?
Cross-Functional Collaboration
Allow line of business to collaborate around digital experiences instead of code
Workflow, preview, and approval automation
Provide feedback on actual features vs inert mock ups
Visuals: One filled green parallelogram shape, slanted so its left edge leans left, with a flat top and bottom edge. It holds the white label 'Cross-Functional Collaboration' centred within it. No photographs, charts, icons or logos.
Slide 13
What is Vercel?
Intelligent Edge Network
Framework-aware edge network delivers your content globally
Zero-config, automatic cache management
SEO and internationalization optimized by default
Leading time-to-first-byte
Visuals: One pink parallelogram shape, slanted so its left and right edges lean to the right (top edge runs from about x 51% to x 81%, bottom edge from about x 43% to x 73%, spanning y 17% to 44% of slide height). It is a flat filled shape with no outline, no shadow, no gradient, and carries the white bold label 'Intelligent Edge Network' centred inside it. No chart, photograph, icon or logo. The four body lines are plain text, not bullets, with no bullet markers.
Slide 14
What is Vercel?
Production Infrastructure
Faster CI/CD
Best-in-class security
Global serverless functions
Instant disaster recovery
Built-in analytics
Visuals: One shape: a light-blue parallelogram (sheared rectangle, top edge horizontal, left and right edges slanted up-right at roughly 60 degrees) with a flat fill, no outline, no shadow, containing the centred label 'Production Infrastructure' in white bold sans-serif. Below it, five plain text lines with no bullet markers, evenly spaced. No photographs, charts, or icons.
Slide 15
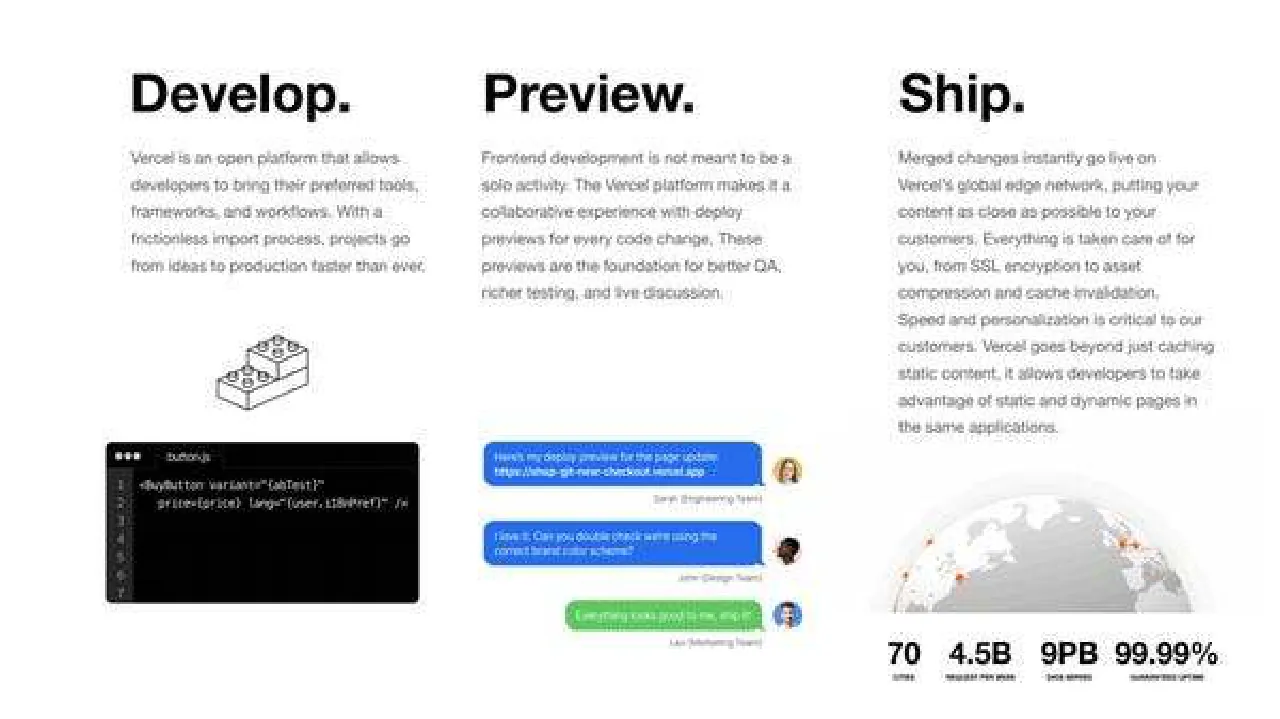
Develop.
Vercel is an open platform that allows developers to bring their preferred tools, frameworks, and workflows. With a frictionless import process, projects go from ideas to production faster than ever.
Preview.
Frontend development is not meant to be a solo activity. The Vercel platform makes it a collaborative experience with deploy previews for every code change. These previews are the foundation for better QA, richer testing, and live discussion.
Here's my deploy preview for the page update: https://vhtsa-git-new-checkout.vercel.app
Sarah (Engineering Team)
Haha, I love it. Can you double check were using the correct brand color scheme?
John (Design Team)
Everything looks good to me, ship it!
Leo (Marketing Team)
Ship.
Merged changes instantly go live on Vercel's global edge network, putting your content as close as possible to your customers. Everything is taken care of for you, from SSL encryption to asset compression and cache invalidation. Speed and personalization is critical to our customers. Vercel goes beyond just caching static content, it allows developers to take advantage of static and dynamic pages in the same applications.
70
4.5B
9PB
99.99%
(small caps labels under the four figures, too small to read)
Visuals: Column 1: a small black-outline isometric illustration of stacked blocks, about 17% to 25% across and 46% to 57% down, drawn in thin dark strokes with small circular studs. Below it is a black code editor window about 8% to 33% across and 61% to 85% down, with three small grey window dots at top left, a filename at the top that is barely legible, a dark grey gutter with line numbers 1 to 7 at the left, and white monospace code lines reading roughly '<BuyButton variant="abTest"' and 'price={price} lang="{user.i18nPref}" />'. Column 2: a chat thread of three bubbles. Bubble one is blue (about #2563EB) at 38% to 60% across and 61% to 68% down with white text, followed by a grey caption and a small circular avatar photo of a woman with long hair at about 60% to 63% across and 63% to 68% down. Bubble two is blue at 38% to 60% across and 72% to 79% down with a small circular avatar of a dark-haired man. Bubble three is green (about #2DBE4E) at 44% to 60% across and 83% to 88% down with white text and a small circular avatar of a person in a blue shirt; all bubbles have rounded corners and a small tail toward the avatar. Column 3: a grey globe illustration about 68% to 93% across and 64% to 85% down, with a pale grey landmass map, light grey horizon halo, and small orange-red dots marking network points; the bottom edge is cropped by the lower boundary of the globe area. Below it is a row of four large bold statistics: '70', '4.5B', '9PB' and '99.99%', each about 3% to 5% of slide height tall.
Slide 16
We turned on Enterprise GTM in February 2020, / and are growing quickly. / Q1 / Q2 / Q3 / Selected Logos
Visuals: Logo cluster of company logos grouped by quarter. Q1 group: Campaign Monitor logo on a dark slate circle (#2E3A44) with small white wordmark, Airbnb logo in white on a coral-red circle (#FF5A5F), and a circular badge with dark navy (#1B2A4A) ground, white dotted ring and red stylised letters. Q2 group: TripAdvisor owl logo with 'tripadvisor' wordmark on a pale blue circle (#A9D8F5), Seale wordmark in orange-pink on a pale yellow-orange circle (#F7C97E), Barnebys serif wordmark in dark grey on a very light grey circle (#F2F2F2), and HARRY ROSEN serif wordmark in white on a black circle (#000000). Q3 group: DEVOLVER DIGITAL red slab wordmark with outline (#C8102E) on white, NZXT white wordmark on a black circle with soft purple glow (#0D0D0D), CV logo in blue and yellow (#2BAEE0 and #F2B705) on white, a purple circle (#5B3CF0) with white lightning-like symbol, HACKERNOON wordmark in black with a small clock icon, HashiCorp black geometric 'H' mark with bold black wordmark, and SmartNews app-icon style logo with rainbow header and grey wordmark on a faint grey-bordered square. Timeline: thin dark grey (#333333) horizontal line about 0.3% of height with a small arrowhead at right end, spanning from Q1 to beyond Q3. Logos are not cropped and sit on white with no overlay.
Slide 17
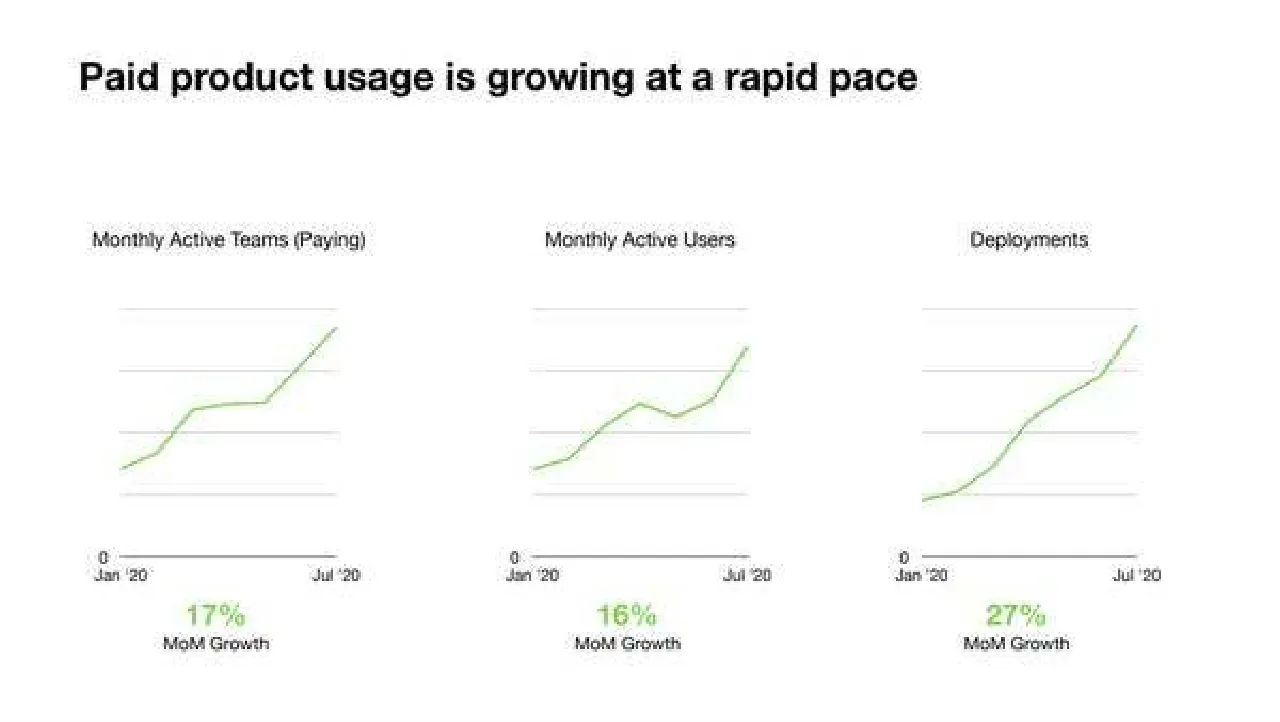
Paid product usage is growing at a rapid pace
Monthly Active Teams (Paying)
Monthly Active Users
Deployments
0 / Jan '20 / Jul '20
0 / Jan '20 / Jul '20
0 / Jan '20 / Jul '20
17%
MoM Growth
16%
MoM Growth
27%
MoM Growth
Visuals: Three small line charts in a row, all with the same style, showing monthly series from Jan '20 to Jul '20. Chart 1 'Monthly Active Teams (Paying)': a single sage-green line rising from about the bottom-left of the plot (roughly 15% of plot height) with a small plateau around the middle of the period and a steeper climb to the top-right end point (about 90% of plot height); no numeric values printed, so the values are estimates only. Chart 2 'Monthly Active Users': a single sage-green line starting low at the left, rising to a dip around the middle-late period and ending steeply at the top-right (about 85% of plot height); values not printed, estimated. Chart 3 'Deployments': a single sage-green line starting lowest of the three at the left (about 5% of plot height), rising steadily and accelerating to the top-right end point (about 95% of plot height); values not printed, estimated. Each chart has four light grey horizontal gridlines and a dark grey horizontal baseline (x-axis) with a '0' label at its left end, and 'Jan '20' and 'Jul '20' labels under the left and right ends. No y-axis numeric scale, units or legend is printed. No points are highlighted. Beneath each chart a large green figure states the month-on-month growth: 17% for teams, 16% for users and 27% for deployments, each followed by the caption 'MoM Growth'. No photographs, logos or icons.
Slide 18
Next.js adoption continues to expand as well / Next.js Monthly Unique Users / Next.js Monthly Builds / 0 / Jan '20 / Jul '20 / 11% / MoM Growth / 0 / Jan '20 / Jul '20 / 20% / MoM Growth
Visuals: Two line charts. Left chart: title 'Next.js Monthly Unique Users' (with 'Next.js' in bold). Type: single line series, steel blue #5B8FC7, about 1.5 px stroke, no markers. Y-axis: starts at 0 at the baseline; no other labelled values, so the scale is unprinted. Four faint horizontal gridlines (light grey #EEEEEE) are drawn above the baseline. X-axis: labelled 'Jan '20' at the left end and 'Jul '20' at the right end. Series shape, estimated: starts about half the height of the top gridline in January and rises steadily and almost linearly, with a slight bend near March, to the top-right end at July, which reaches about the top gridline. No legend and no highlighted points. Right chart: title 'Next.js Monthly Builds' (with 'Next.js' in bold). Same styling: steel blue #5B8FC7 line, four light grey gridlines, zero baseline, labels 'Jan '20' and 'Jul '20'. Series shape, estimated: nearly flat and low in January (about one quarter of the top gridline), a small rise by late February, a steep climb between roughly March and May to about two thirds of the top gridline, then a flattening rise to just under the top gridline at July. No legend and no highlighted points. Below each chart is a callout: left '11%' and right '20%', both set in blue #4A90D9 above the caption 'MoM Growth' in near-black #222222. Figures are printed as values, so no estimate is needed for them.
Slide 19
Next.js Adoption: 2Q20 / Top 1m sites: / May: 4,370 -> August: 5,397 (+23.5%) / Top 100k sites: / May: 1,124 -> August: 1,369 (+21.8%) / Top 10k sites: / May: 304 -> August: 371 (+22.0%) / Gatsby comparison: / Top 1m: 2,606 -> 2,935 (+12.6%) / Top 100k: 590 -> 674 (+14.2%) / Top 10k: 159 -> 186 (+17.0%) / 6,000 / 5,000 / 4,000 / 3,000 / 2,000 / 1,000 / Top 1M sites / Top 1M sites (gatsby) / 1,400 / 1,200 / 1,000 / 800 / 600 / 400 / 200 / Top 100k sites / Top 100k sites (gatsby) / 400 / 300 / 200 / 100 / Top 10k sites / Top 10k sites (gatsby) / Jan 2020 / Mar 2020 / May 2020 / Jul 2020
Visuals: Three stacked line charts, each with a legend across its top and a gridline-free background with faint light-grey horizontal gridlines. Chart 1 (top): title none; y-axis labelled 1,000 to 6,000 in steps of 1,000 (no units printed); x-axis Jan 2020 to Jul 2020 shown only once below chart 3; series 'Top 1M sites' solid blue line rising from about 2,800 in January to about 5,400 at the right edge by August, and series 'Top 1M sites (gatsby)' dotted light-grey line rising from about 2,000 to about 2,900; legend at top: blue dash 'Top 1M sites' and grey dotted 'Top 1M sites (gatsby)'. Chart 2 (middle): y-axis 200 to 1,400 in steps of 200; series 'Top 100k sites' solid red line rising from about 720 in January to about 1,370 in August; series 'Top 100k sites (gatsby)' dotted grey rising from about 420 to about 680; legend red dash and grey dotted. Chart 3 (bottom): y-axis 100 to 400 in steps of 100; series 'Top 10k sites' solid orange/tan line rising from about 225 in January to about 370 in August; series 'Top 10k sites (gatsby)' dotted light-grey rising from about 120 to about 190; legend orange dash and grey dotted. No highlighted points, no data labels, no markers; values for the chart lines are estimates marked 'about' because the slide prints no point values. Percentages in the left column are highlighted in magenta.
Slide 20
Visuals: One filled black isosceles triangle, apex pointing up. Apex at about x 50%, y 43%. Base spans about x 45.5% to 54.3% at about y 57%. Solid black fill (#000000) with no outline, no shadow and no gradient. It is not cropped, boxed or overlaid.