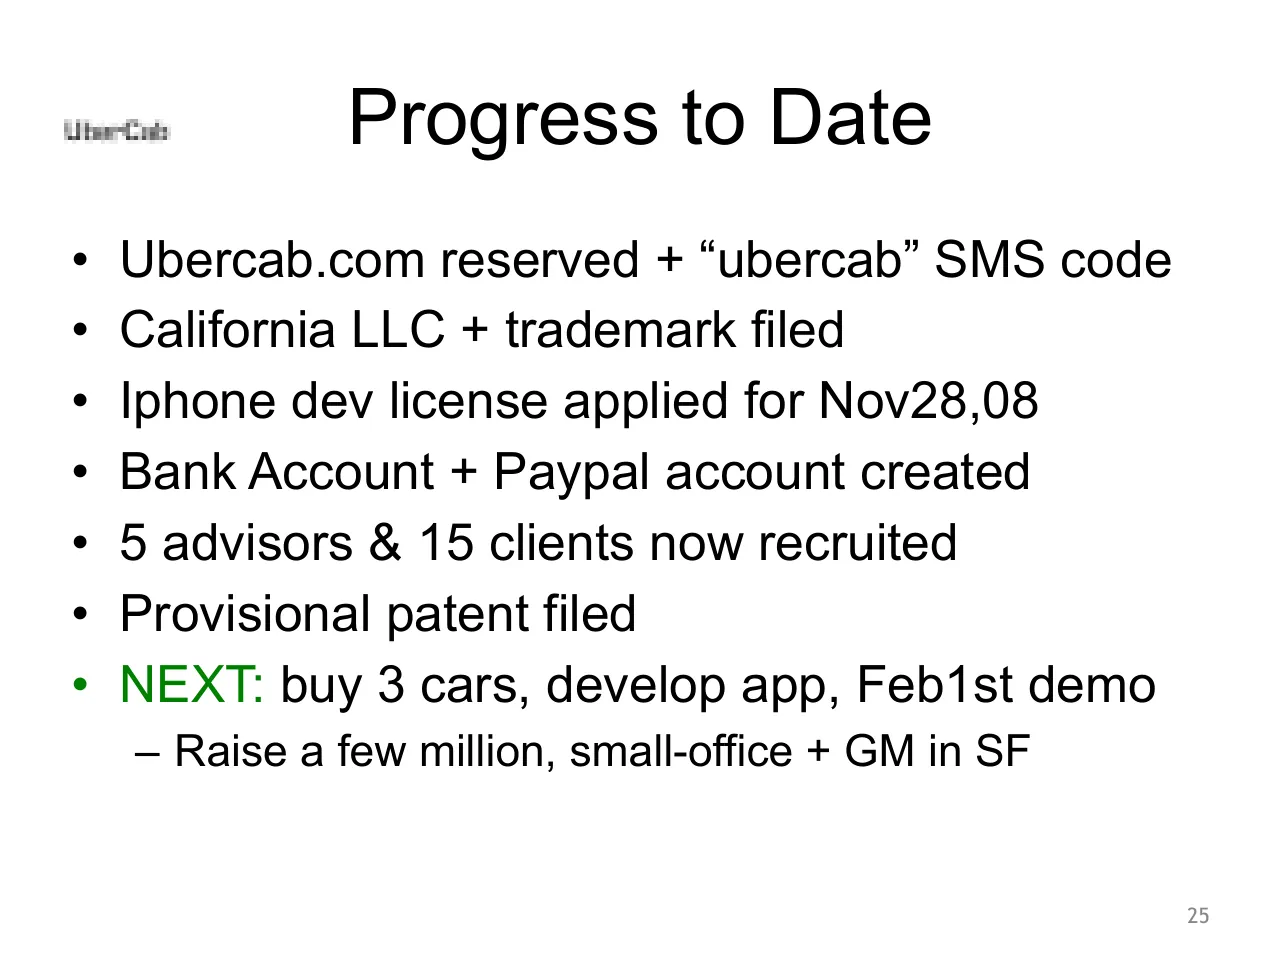
The deck opens by framing the state of San Francisco and New York taxi service in 2008, citing aging dispatch technology, fuel-inefficient vehicles and the medallion system as the problem. It then introduces UberCab as a members-only, one-click, on-demand car service with a geo-aware app and a luxury hybrid fleet. The middle sections cover key differentiators, operating principles, app and web features, use cases, user and environmental benefits, fleet and service area, technology, demand forecasting and market size. Later slides estimate the market, list target cities, set out best-case, realistic and worst-case outcomes, and sketch future optimizations and marketing ideas. The deck closes with a progress-to-date slide listing completed steps and the next milestones of buying cars, building the app and a February demo. Slides worth studying include the problem slide with its bold statistics, the market size slide with its single headline figure, and the progress slide that shows what has been done so far.
Slides worth studying
Questions about this deck
How many slides does the UberCab deck have?
The UberCab deck has 25 slides. Slide 25 is the Progress to Date slide, which lists completed steps and the next milestones.
What does the UberCab deck say about the market size?
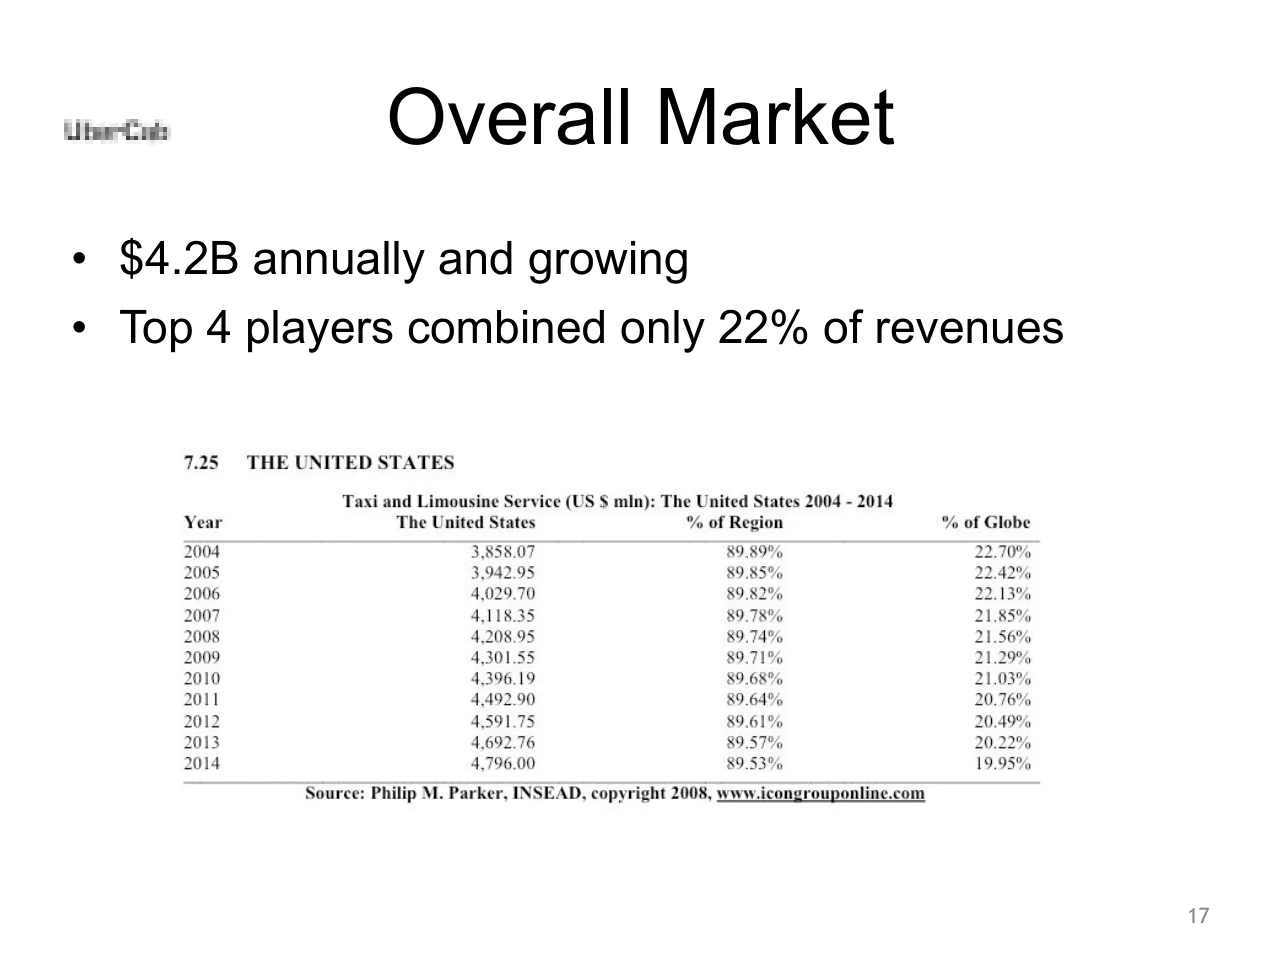
Slide 17 states that the UberCab overall market is $4.2B annually and growing, and that the top 4 players combined only hold 22% of revenues. Slide 19 lists the 2009 Taxi and Limousine Service figures for individual US cities.
What potential outcomes does the UberCab deck describe?
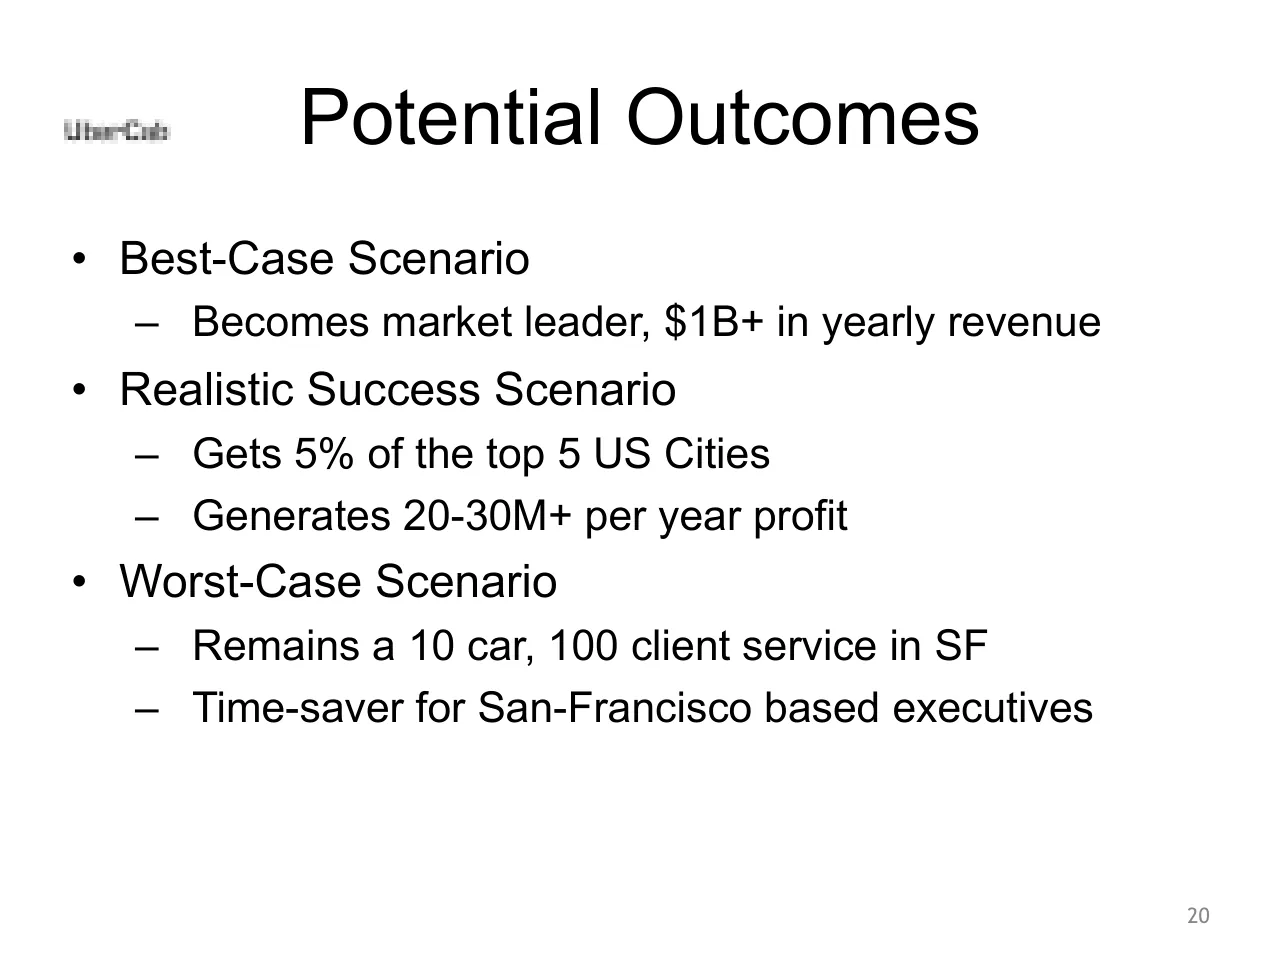
Slide 20 describes a best-case scenario in which UberCab becomes the market leader with $1B+ in yearly revenue. Its realistic success scenario is to get 5% of the top 5 US cities and generate 20-30M+ per year profit.
What fuel efficiency does the UberCab fleet deck give?
Slide 13 says the premium fleet includes the S550 for SF Beta clients and gets 30mpg with the S400 BlueHybrid (in 2010). The standard fleet of Lexus GS450h or e320 gets 23mpg, while existing cab and towncar fleets get 14-16 mpg.
Details
- Company: Uber (as UberCab)
- Year: 2008
- Type: Pitch deck
- Industry: Transportation
- Pages: 25
Review score: 5 out of 10, Needs substantial work
Presentation quality, judged with the SlideDeck Co review heuristic. Ask, evidence and idea merit are not rated here.
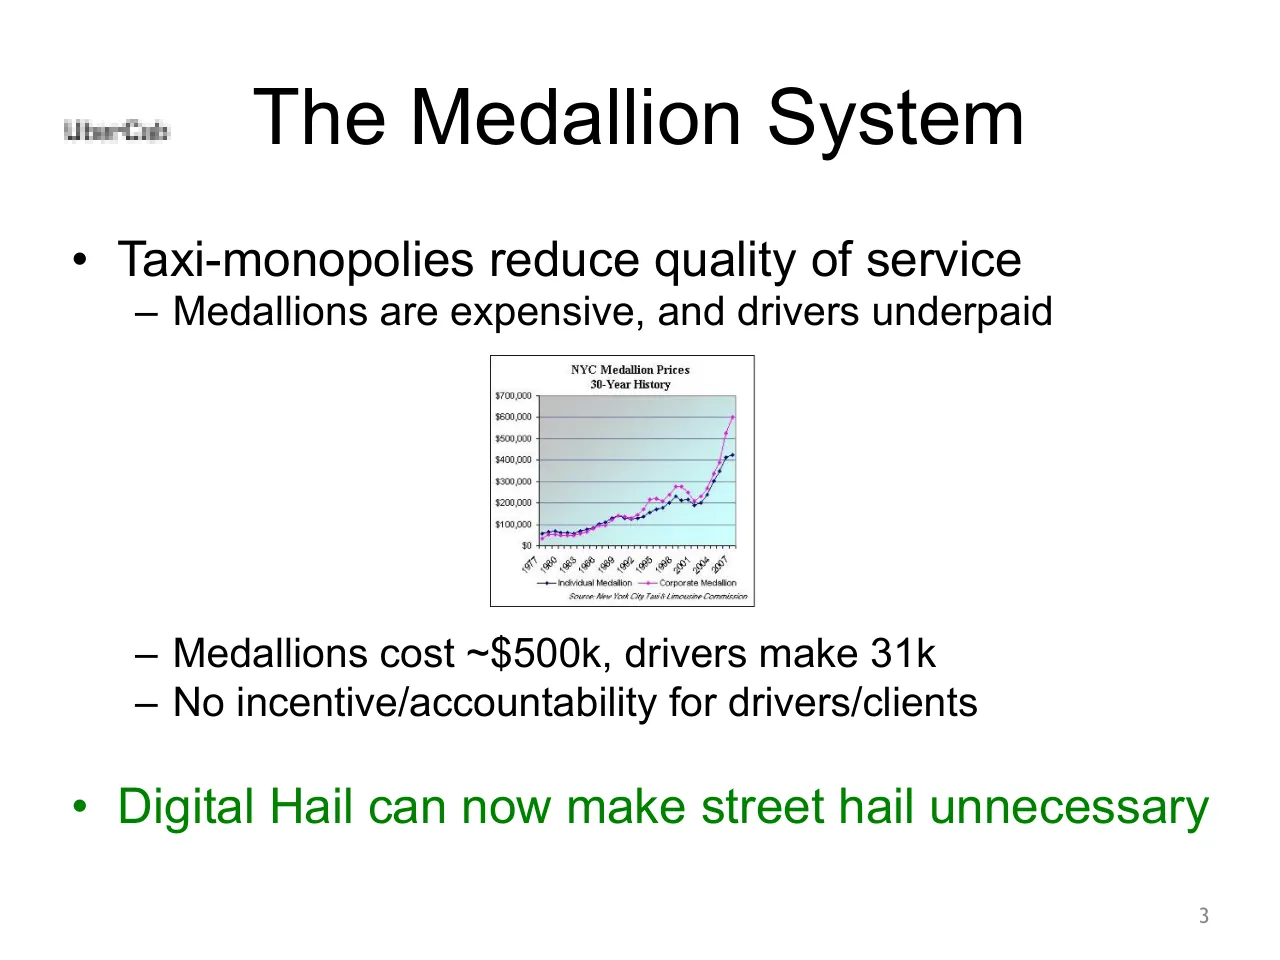
The story route is easy to follow (problem on slides 2-3, concept on 4-6, features, market, outcomes, progress on 25), and the text is large and legible. But nearly every page is a default bulleted list with a centered title, so there is no hierarchy beyond title and bullets and no visual rhythm across 25 slides. Several visuals are weak: the medallion chart on slide 3 is tiny, the slide 17 table is a scanned-looking page with no highlighted figure, and the slides 21 and 24 smartphone charts are unreadable and loosely tied to their points. The logo is a blurry thumbnail on every slide, and slide 25 leaves most of the page empty. The core can be recovered but substantial revision is needed.
Worth keeping: Keep the plain problem-to-solution-to-progress order, the large readable bullet text, and the green accent on the slide 3 takeaway and the NEXT line on slide 25.
Most useful repair: Replace the pasted tables and charts on slides 3, 17, 19, 21 and 24 with one clean, enlarged chart or a single big number each, and swap the blurry logo for a crisp version.
What would change the score: I would turn the bullet lists into assertion titles with one visual per slide, such as the app screens or a trip flow, and merge the thin slides (7, 14, 22, 23) so the deck gets a clear rhythm.
Confidence high. 25 of 25 pages inspected on contact sheets, 4 at readable size. Reviewed 2026-11-08. Model-assisted review (claude-sonnet-5-5).
Full text of the slides (25 slides)
Every slide's words and a description of its charts and images, so the deck can be searched and rebuilt. Also available as Markdown.
Slide 1
UberCab
Next-Generation Car Service
1
Visuals: Centre: photograph/cut-out of a black four-door luxury sedan (Mercedes-style S-Class saloon) in three-quarter front view facing right, wheels with silver multi-spoke alloys, chrome window trim and grille, soft grey floor shadow beneath, white background, no crop, boxed only by its own white. Left: a black smartphone with a colourful icon grid on screen, held upright, front-facing, with a silver rim, about 6.7% wide. Right: a black BlackBerry-style handheld with a QWERTY keyboard and dark screen, front-facing, with a faint reflection beneath, about 6.7% wide. Top: the 'UberCab' wordmark rendered as a logo in bold black geometric sans-serif letters. No other graphics. Lighting is even studio light; dominant colours are black, silver and white.
Slide 2
UberCab
Cabs in 2008
• Most use aging & inefficient technology
– Radio dispatch, no 2-way communication
– Most common car, Ford Crown Victoria = 14mpg
• Hailing is done by hand or phone
– No GPS coordination between client/driver
– Significant fareseeking or “dead-time”
2
Visuals: One photograph of a yellow New York City taxi (Ford Crown Victoria) in side profile, facing right, on a white studio background. It shows a full side view with the roof light on top, checkered taxi stripe, plate 7C43, NYC TAXI logo on the door and small measurement labels on the body. Lit evenly from above with soft shadow beneath the wheels; yellow and black dominant colours. Boxed, not cropped, with a thin light-grey edge; caption 'Ford Crown Victoria' printed small in the bottom-right corner of the image. Logo: a small pixelated 'UberCab' wordmark in black at top left, not overlapping other elements.
Slide 3
UberCab / The Medallion System / • Taxi-monopolies reduce quality of service / – Medallions are expensive, and drivers underpaid / NYC Medallion Prices / 30-Year History / $700,000 / $600,000 / $500,000 / $400,000 / $300,000 / $200,000 / $100,000 / $0 / 1977 / 1980 / 1983 / 1986 / 1989 / 1992 / 1995 / 1998 / 2001 / 2004 / 2007 / Individual Medallion / Corporate Medallion / Source: New York City Taxi & Limousine Commission / – Medallions cost ~$500k, drivers make 31k / – No incentive/accountability for drivers/clients / • Digital Hail can now make street hail unnecessary / 3
Visuals: One line chart, a picture placed at about x 38.3% y 37.0% with width 20.8% and height 26.1% (313 by 294 pixels), boxed with a thin dark grey border. Chart title: NYC Medallion Prices / 30-Year History, in small bold serif type centred above the plot. Y axis: US dollars, from $0 to $700,000, gridlines and labels every $100,000. X axis: years, labels 1977, 1980, 1983, 1986, 1989, 1992, 1995, 1998, 2001, 2004, 2007, angled about 45 degrees. Series 1: Individual Medallion, navy line with small diamond markers, starting about $55,000 in 1977, roughly flat near $60,000 to $80,000 until about 1986, rising to about $130,000 around 1990, about $230,000 near 2001, dipping to about $190,000 near 2003, and ending about $420,000 near 2008. Series 2: Corporate Medallion, magenta line with small square markers, starting about $35,000 in 1977, tracking Individual closely until about 1995, peaking about $280,000 near 2000, dipping to about $200,000 near 2003, and ending about $600,000 near 2008 as the highest point. Legend below the plot: navy marker Individual Medallion and magenta marker Corporate Medallion. Source line in italic at the bottom of the chart: Source: New York City Taxi & Limousine Commission. Plot area has a grey-to-light-cyan gradient fill. Also a small pixelated UberCab wordmark logo in dark grey at top-left, about 26 by 6 pixels.
Slide 4
UberCab Concept
UberCab
A fast & efficient on-demand car service
Market: Professionals in American cities
Convenience of a cab in NYC + experience of a / professional chauffeur. But in SF and NYC
Latest consumer web & device technology
– automate dispatch to reduce wait-time
Optimized fleets and incented drivers
The “NetJets of car services”
4
Visuals: One small raster logo image, 26 by 6 pixels, reading 'UberCab' in dark grey-black pixelated lettering at the top-left beside the title. No photographs, charts or other graphics. The slide has no other non-text visual elements.
Slide 5
UberCab
1-Click Car Service
• Must be a member to use the service
– Professional and trustworthly clientele
Not hailed from street
– So no medallion licenses are required, since
clients are service members & use digital-hail
• Guaranteed Pick-up (unlike a yellowcab)
– Mobile app will match client & driver
– See photos of each other
5
Visuals: One small raster logo at top left, reading 'UberCab' in black lettering on a white ground. It is a low-resolution image, 26 by 6 pixels, so the letterforms are blurred and pixelated. It is not cropped, has no overlay or tint, and is not boxed. No other visual elements (no photographs, charts, or diagrams).
Slide 6
Key Differentiators
• Members Only - Respectable clientele
• 1-click hailing – “Pickup here in 5 mins”
• Fast Response time – easier than calling
• Luxury automobiles – Mercedes Sedans
• Great drivers – “Rate your trip” feature
• High-tech solution: Geo-aware auto-dispatch
• Optimized fleet – Logistical LBS software
6
Visuals: One small raster logo at upper left (26 by 6 pixels, pixelated, shown at 8.3% width) reading UberCab in dark grey and black, placed to the left of the title. No photographs, charts, or diagrams. Logo is not cropped, boxed, or overlaid.
Slide 7
Operating Principles
Luxury service on-demand
Modern and fuel-efficient fleet
Customer-focused, computer-coordinated
The best end-user experience possible
Statistically optimized response time
Pre-paid, cashless billing system
Profitable by design
7
Visuals: One small logo at top-left: a pixelated, low-resolution rendering (26 by 6 pixels) of the wordmark 'UberCab' in dark grey and black, appearing as a blurred raster image. No charts, photographs or other illustrations.
Slide 8
UberCab apps
• 1-Click request from Geo-aware devices
• SMS from any phone: “pickup @work in 5”
8
Visuals: Three product photographs of mobile phones, shown front-on on a white background with no cropping, boxes or overlays. Left: an Apple iPhone (first-generation style) with a black front, a silver bezel and a home screen showing app icons (Text, Calendar, Photos, Camera, Calculator, Stocks, Maps, Weather, Notes, Clock, Settings, UberCab; dock icons Phone, Mail, Safari, iPod). The status bar reads 'cingular' and '9:41 AM'. Centre: a BlackBerry Bold-style handset with a black body, silver edge, a blank dark grey screen, a black QWERTY keyboard and a trackball, with a soft reflection beneath it. Right: a Nokia E71 in silver and black with a QWERTY keyboard; its screen shows 'Operator', 'We 30.04.2008', and the entries 'Mail for Exchange (12)', 'Amanda Lund Business report', 'Mymail (5)', '11:00-12:00 Sales meeting' and 'WLAN network found', with the labels 'Menu' and 'Camera' below. The small logo at top left is a pixelated 'UberCab' wordmark in dark grey.
Slide 9
UberCab.com
• Book Trips, show Fleet status, trip history
• Pre-specify locations with labels + coordinates
– To enable easy texting of pickup locations
• Google Maps integration
– Lat/long for “home”, “bob-work”, “alice-apt”
9
Visuals: One photograph-style street map image, boxed and not cropped, centred below the bullets at about x 35.1%, y 62.6%, 28.3% by 26.1% of the slide (427 by 294 pixels). It is a Google Maps-style street map of San Francisco, with a pale yellow major-road network, white and light grey city blocks, pale green parks, and labels for streets and places including Jackson St, California St, Pine St, Bush St, Geary Blvd, Turk St, Golden Gate Ave, Fell St, Oak St, Presidio Ave, Masonic Ave, Divisadero St, Fillmore St, Stanyan St, Arguello Blvd, Hamilton Recreation Center, Western Addition, Jefferson Square, Margaret S. Hayward Playground, Alamo Square, University of San Francisco, St Mary's Medical Center, Buena Vista Park, Duboce Ave, Hermann St, Alta Plaza, Lafayette Park, Central Fwy and the 101 and 10 highway shields. Overlaid on the map are about eight purple-grey camera icons and about four blue teardrop map pins marking locations, with thin brown-grey route lines connecting them. Colours are yellow, white, grey, green, purple and blue. There is no tint or overlay. Also one small logo: a pixelated dark grey and black wordmark reading UberCab at top left, about 5.0% from the left, 12.4% from the top, 8.3% by 2.6%, unboxed.
Slide 10
Use-Cases
Trips to/from restaurants, bars & shows
Fast local transport where parking isn’t easy
Airport pickup/dropoff (pre-scheduled)
Working while commuting (wifi in cars)
3 person rideshare to a South-Bay campus
Dropping off Kids at School
Elderly transport
10
Visuals: One small low-resolution raster logo at the top left reading 'UberCab' in dark grey/black pixelated type, placed at about 5% from the left edge and vertically aligned with the title; it is not cropped, boxed or tinted. No charts, photographs, diagrams or other graphics.
Slide 11
User Benefits
• Cabs don’t guarantee pickup, can take 45 mins
• Cab aren’t as safe or clean as limos
• Car services require 1-3 hours notice
• Car services transfers average over $60 + tax
• UberCab would be faster & cheaper than a limo, but
nicer & safer than a taxicab
11
Visuals: One small raster wordmark at top left reading 'UberCab' in a dark grey-black pixelated sans-serif, roughly 26 by 6 pixels, unboxed and placed on white with no overlay. No charts, photographs or diagrams.
Slide 12
UberCab
Environmental Benefits
• Better Utilization of Vehicle Resources
– In NYC, 35% of time is spend looking for fares
– In less dense cities, can be over half “dead-time”
– As swarm size increases, efficiency will improve
• Hybrid vehicles (2x efficiency of a cab)
– Mercedes S400 BlueHybrid, Lexus GS-450h
– Reduce carbon footprint, better use of time in car
• Ridesharing/Carpooling incentives – lower rates
– Trip to SFO, or Ballpark to Marina after a game
12
Visuals: One small raster logo, a 26 by 6 pixel image at top-left (x 5.0%, y 12.4%, 8.3% by 2.6%) reading UberCab in a low-resolution grey and black wordmark, slightly blurred. No charts, photographs, diagrams or other graphics.
Slide 13
UberCab Fleet
• Premium – S550 for SF Beta clients
• 30mpg with S400 BlueHybrid (in 2010)
• Standard – Lexus GS450h or e320– 23mpg
• Existing cab/towncar fleets get 14-16 mpg
13
Visuals: Two photographs of black sedans, both shown in side profile facing right on a white studio background with a soft grey ground shadow beneath each car. Left: a black Mercedes-Benz C-Class sedan, smaller, placed at about x 20.8%, y 58.9%, 25.0% by 13.0% of the slide (375 by 148 pixels). Right: a black Mercedes-Benz S-Class sedan, larger, placed at about x 50.0%, y 57.8%, 28.3% by 14.3% of the slide (541 by 204 pixels). Both cars are fully visible, not cropped, boxed by no frame, with glossy black paint, silver five-spoke alloy wheels and chrome grille trim, lit evenly from the front. The dominant colours are black, silver and white. One small pixelated UberCab wordmark logo in grey and black at top left, at x 5.0%, y 12.4%, 8.3% by 2.6% of the slide (26 by 6 pixels).
Slide 14
Initial Service Area / Central SF to Start, Manhattan soon after / 14
Visuals: One street map of central San Francisco (photograph-style map raster, 525 by 515 pixels) placed as a boxed, unbordered rectangle centered horizontally at roughly 29 to 67 percent of slide width and 34 to 85 percent of slide height. The map is a Google-style road map: pale grey-beige city blocks, yellow major roads, light blue water to the north and east (San Francisco Bay), green park patches (Presidio, Golden Gate area, Buena Vista Park, Mission Dolores Park, Twin Peaks Park), and black/dark-grey labels for neighborhoods (Marina District, North Beach, Pacific Heights, Western Addition, Richmond District, Mission Dolores Park, Buena Vista Park, Interior Park Belt, Twin Peaks Park, Forest Hill, Bernal Heights Park), streets (Marina Blvd, Bay St, Lombard St, Broadway, Pine St, Geary St, Geary Blvd, Fulton St, Oak St, Market St, 16th St, 17th St, Clipper St, Cesar Chavez, Divisadero St, Franklin St, Van Ness Ave, Gough St, Larkin St, Hyde St, Jones St, Howard St, Folsom St, 1st St, 2nd St, 3rd St, 4th St, 7th St, King St), and highways (US 101 and I-80 shields, I-280 shield, Central Freeway, John F Foran Fwy). A single red-and-pink map pin marked 'A' sits over the downtown area just above the words 'San Francisco' printed on the map. Highway shields are white with black outlines and red/blue markings. A small arrow icon sits at the upper-left corner of the map and a scale bar sits at the lower-left corner. Composition is a top-down full map view, unCropped in the sense that the map edges are visible on all sides; the map is not tinted or overlaid. Lighting is flat, as in a screenshot. Dominant colours: light grey, pale yellow, pale green, and light blue. A small logo at top-left reads 'UberCab' in a dark grey pixelated wordmark, roughly 5 percent from the left and 12 percent from the top.
Slide 15
UberCab
Technology
• Mobile phones + intelligent scheduling
– Applications for iphone, blackberry, symbian
– Operations research for route optimization
• Payment/utilization/reputation tracking
• Patent-pending system design
15
Visuals: One illustration centred below the first bullet group: three side-by-side scatter-line plots, each in a thin black-bordered box with tick labels. Panel 1 (left): x-axis ticks 10, 20, 30, 40, 50, 60; y-axis ticks 10 to 70 in steps of 10; multicoloured polylines (red, blue, purple, green, pink, cyan) radiating from a common hub at about (35, 30) with many small point markers. Panel 2 (centre): x-axis ticks -80, -40, 0, 40, 80; y-axis ticks -40, 0, 40, 80; coloured polylines (red, green, pink, orange, teal) radiating from a hub at about (0, 0). Panel 3 (right): x-axis ticks -1200, -800, -400, 0; y-axis ticks -200, 0, 200, 400, 600; longer yellow, purple, teal, blue and green polylines converging on a cluster near (0, 0). No printed values beyond the tick labels and no legend. The image is not cropped, full-bleed or tinted.
Slide 16
Demand Forecasting / Cars hover in statistically optimized positions / minimize expected pickup time given hour of week & / weather/traffic conditions / 16
Visuals: One photograph/illustration: a black-background map-style image of a city street network rendered as dense white and grey overlapping line traces (roads and routes) with several bright yellow highlighted routes. Yellow circles mark a few points: one at upper-right of the central cluster, one at lower-left of the central cluster, and one at lower-right near the bottom-right of the cluster. A thick yellow route runs across the top edge from left to the centre, and a thinner yellow dotted route runs from the top-right corner down toward the centre. Subject: visualised car routes over city streets. Composition: full rectangular image, not cropped, boxed with hard square corners, placed centrally in the lower half; no overlay or tint. Lighting: none (flat graphic). Dominant colours: black background, white/light grey lines, bright yellow (#FFD700-like) highlights. Also one small logo: the UberCab wordmark in grey-black pixelated text at upper-left next to the title.
Slide 17
UberCab
Overall Market
$4.2B annually and growing
Top 4 players combined only 22% of revenues
7.25 THE UNITED STATES
Taxi and Limousine Service (US $ mln): The United States 2004 - 2014
Year
The United States
% of Region
% of Globe
2004 3,858.07 89.89% 22.70%
2005 3,942.95 89.85% 22.42%
2006 4,029.70 89.82% 22.13%
2007 4,118.35 89.78% 21.85%
2008 4,208.95 89.74% 21.56%
2009 4,301.55 89.71% 21.29%
2010 4,396.19 89.68% 21.03%
2011 4,492.90 89.64% 20.76%
2012 4,591.75 89.61% 20.49%
2013 4,692.76 89.57% 20.22%
2014 4,796.00 89.53% 19.95%
Source: Philip M. Parker, INSEAD, copyright 2008, www.icongrouponline.com
17
Visuals: Logo: a small, pixelated, blurred UberCab wordmark in dark grey (about #333333) at the top left, roughly 26 by 6 pixels. Table image: a raster scan of a printed book table occupying x 12.5%, y 45.6%, w 70.8%, h 41.1%, placed unboxed on the white background with no border or shadow. Its content is titled '7.25 THE UNITED STATES' in bold serif capitals, with the caption 'Taxi and Limousine Service (US $ mln): The United States 2004 - 2014'. The columns are Year, The United States, % of Region and % of Globe, and the rows are 2004 to 2014 with values as printed: 2004 3,858.07 / 89.89% / 22.70%; 2005 3,942.95 / 89.85% / 22.42%; 2006 4,029.70 / 89.82% / 22.13%; 2007 4,118.35 / 89.78% / 21.85%; 2008 4,208.95 / 89.74% / 21.56%; 2009 4,301.55 / 89.71% / 21.29%; 2010 4,396.19 / 89.68% / 21.03%; 2011 4,492.90 / 89.64% / 20.76%; 2012 4,591.75 / 89.61% / 20.49%; 2013 4,692.76 / 89.57% / 20.22%; 2014 4,796.00 / 89.53% / 19.95%. A thin grey rule sits under the header row and another above the source line. Text is black serif (Times-like) on white, and the image has no overlay or tint and is not cropped.
Slide 18
UberCab / Composition of Market / • Focus on Urban service on-demand / MAJOR MARKET SEGMENTS / Market Segment / Share / Retail - non-airport trips / 64.0% / Business - non-airport trips / 15.0% / Retail - airport trips / 12.0% / Business - airport trips / 9.0% / • 2007 Market / 18
Visuals: One picture of a pie chart, a 539 by 240 pixel raster image placed at x 12.6%, y 31.1%, w 74.7%, h 44.4%, with no border, crop or overlay. Chart type: pie chart. Its embedded heading reads 'MAJOR MARKET SEGMENTS' in red-orange (about #C0504D) capitals in a sans-serif face. Slices, starting at 12 o'clock and running clockwise: Retail - non-airport trips 64.0% in brown (#946B2D), about 230 degrees; Business - non-airport trips 15.0% in plum purple (#6F4C7E), about 54 degrees; Retail - airport trips 12.0% in teal (#6AABAB), about 43 degrees; Business - airport trips 9.0% in pale greige (#E2D8D2), about 32 degrees. No axes, no highlighted points, no printed series values other than the shares. The legend is a two-column table embedded in the same picture: header row 'Market Segment' and 'Share', a rule under the header, then four rows, each with a coloured square swatch matching its slice and the label and value listed above. Value labels are not printed on the slices themselves. There is also a small logo picture at x 5.0%, y 12.4%, w 8.3%, h 2.6%: the UberCab wordmark in dark grey and black, pixelated, with no icon.
Slide 19
Target Cities
Focus on SF/NYC to begin
Expand to LA, Chicago, Houston, PA, Dallas
This covers 50% of entire US market
North America & the Caribbean
168
The United States: Taxi and Limousine Service in 2009, US $ mln
City / World Rank / US $ mln / %Country / %Region / %World
New York 1 978.53 22.75 20.41 4.84
Los Angeles 3 354.23 8.23 7.39 1.75
Chicago 5 325.61 7.57 6.79 1.61
Houston 12 189.53 4.41 3.95 0.94
Philadelphia 15 168.01 3.91 3.50 0.83
Dallas 21 120.01 2.79 2.50 0.59
San Jose 23 118.63 2.76 2.47 0.59
San Francisco 25 116.79 2.71 2.44 0.58
San Diego 26 113.64 2.64 2.37 0.56
Detroit 31 108.92 2.53 2.27 0.54
Phoenix 32 108.27 2.52 2.26 0.54
San Antonio 39 90.62 2.11 1.89 0.45
Indianapolis 46 77.28 1.80 1.61 0.38
Baltimore 51 72.14 1.68 1.50 0.36
Washington D.C. 54 70.28 1.63 1.47 0.35
Others 1,289.07 29.97 26.88 6.38
Total 4301.55 100.00 89.71 21.29
Source: Philip M. Parker, INSEAD, copyright 2008, www.icongrouponline.com
19
Visuals: One raster image of a financial table, placed at about x 20.0%, y 48.0%, w 56.7%, h 43.0% (747 by 425 pixels), with no border or shadow. Table title: The United States: Taxi and Limousine Service in 2009, US $ mln (bold serif, small caps-style header). Header row of a serif book-style table with top rule and a double rule beneath the page header 'North America & the Caribbean 168'. Columns: City; World Rank; US $ mln; %Country; %Region; %World. Rows, in order: New York | 1 | 978.53 | 22.75 | 20.41 | 4.84. Los Angeles | 3 | 354.23 | 8.23 | 7.39 | 1.75. Chicago | 5 | 325.61 | 7.57 | 6.79 | 1.61. Houston | 12 | 189.53 | 4.41 | 3.95 | 0.94. Philadelphia | 15 | 168.01 | 3.91 | 3.50 | 0.83. Dallas | 21 | 120.01 | 2.79 | 2.50 | 0.59. San Jose | 23 | 118.63 | 2.76 | 2.47 | 0.59. San Francisco | 25 | 116.79 | 2.71 | 2.44 | 0.58. San Diego | 26 | 113.64 | 2.64 | 2.37 | 0.56. Detroit | 31 | 108.92 | 2.53 | 2.27 | 0.54. Phoenix | 32 | 108.27 | 2.52 | 2.26 | 0.54. San Antonio | 39 | 90.62 | 2.11 | 1.89 | 0.45. Indianapolis | 46 | 77.28 | 1.80 | 1.61 | 0.38. Baltimore | 51 | 72.14 | 1.68 | 1.50 | 0.36. Washington D.C. | 54 | 70.28 | 1.63 | 1.47 | 0.35. Others | (blank) | 1,289.07 | 29.97 | 26.88 | 6.38. Total | (blank) | 4301.55 | 100.00 | 89.71 | 21.29 (Total row in bold). Footer line in the image: Source: Philip M. Parker, INSEAD, copyright 2008, www.icongrouponline.com (bold serif, URL underlined). Table is black text on white with thin black and grey horizontal rules. Also one small logo: a pixelated grey UberCab wordmark at the top left, about x 5.0%, y 12.4%, w 8.3%, h 2.6%, dark grey (#444444) with blocky low-resolution edges.
Slide 20
UberCab
Potential Outcomes
• Best-Case Scenario
– Becomes market leader, $1B+ in yearly revenue
• Realistic Success Scenario
– Gets 5% of the top 5 US Cities
– Generates 20-30M+ per year profit
• Worst-Case Scenario
– Remains a 10 car, 100 client service in SF
– Time-saver for San-Francisco based executives
20
Visuals: One non-text element: a small, pixelated UberCab wordmark logo at the top left, about 26 by 6 pixels, in dark grey to black. It is not cropped, boxed or tinted. No photographs, charts, tables or diagrams.
Slide 21
SmartPhones, Aug2008 / Smartphone Requests by OS: US / RIM OS / Windows Mobile OS / Palm OS / iPhone OS / Hiptop OS / Symbian OS / 32% / 30% / 19% / 10% / 6% / 3% / Note: Above share % refers only to requests from Smartphones / Smartphone Manufacturer Share by Region / 100% / 90% / 80% / 70% / 60% / 50% / 40% / 30% / 20% / 10% / 0% / Africa / Asia / Australia / Eastern Europe / Latin America / North America / Western Europe / Other / Samsung / SonyEricsson / Apple / HTC / Palm / RIM / Nokia / 21
Visuals: Two charts, no photographs. (1) Pie chart titled 'Smartphone Requests by OS: US', with no axes. Slices and printed values, clockwise from 12 o'clock: RIM OS 32% (blue, about #6F98C9), Windows Mobile OS 30% (red, about #BE6A60), Palm OS 19% (olive green, about #9CB067), iPhone OS 10% (purple, about #8A74A6), Hiptop OS 6% (light blue, about #7FB1C9), Symbian OS 3% (orange, about #E09C4C). Legend to the right of the pie in the same order, each with a small coloured square. Percent labels are printed inside or beside each slice in dark text. A note line sits inside the box at the bottom-left. (2) Stacked 100% column chart titled 'Smartphone Manufacturer Share by Region'. Y-axis 0% to 100% in 10% steps with light grey gridlines. X-axis categories: Africa, Asia, Australia, Eastern Europe, Latin America, North America, Western Europe. Series, bottom to top: Nokia (dark blue, about #3B5F8F), RIM (dark red-brown, about #6E3A32), Palm (olive green, about #5E7A2E), HTC (purple, about #8A74A6), Apple (light blue, about #7FB1C9), SonyEricsson (orange, about #E09C4C), Samsung (grey, about #8C8C8C), Other (pink, about #E3B4B0). No values are printed on the bars, so these are estimates: Africa Nokia about 92%, Other and SonyEricsson together about 4%. Asia Nokia about 93%, small Apple and SonyEricsson segments. Australia Nokia about 81%, RIM about 1%, HTC about 2%, Apple about 6%, Other about 4%. Eastern Europe Nokia about 91%, Apple about 2%. Latin America Nokia about 54%, RIM about 9%, Palm about 2%, HTC about 5%, Apple about 12%, SonyEricsson about 3%, Other about 15%. North America Nokia about 3%, RIM about 33%, Palm about 19%, HTC about 13%, Apple about 10%, Samsung about 5%, Other about 17%. Western Europe Nokia about 73%, RIM about 2%, HTC about 5%, Apple about 9%, SonyEricsson about 7%, Other about 4%. Legend to the right of the bars, top to bottom: Other, Samsung, SonyEricsson, Apple, HTC, Palm, RIM, Nokia, each with a coloured square. The category labels 'North America' and 'Western Europe' run into each other at the baseline. Both charts are flat, with no shadows or gradients.
Slide 22
Future Optimizations / • Cheaper cars by buying used / • Less expensive hybrid vehicles (prius) / • More accurate GPS technology / • Discounted rates for Sun-Tues multi-hour bookings / • Pay premium for on-demand service / • “get here now” costs more than “tomorrow at 5pm” / 22
Visuals: A small low-resolution raster logo reading UberCab in dark grey, placed at the top left (26 by 6 pixels, a pixelated wordmark). No charts, photographs or other illustrations.
Slide 23
Marketing Ideas
YellowCab is the only recognizable brand
– Become the ubiquitous “premium” cab service
Invite Only, referred from an existing member
Possible slogan: The One-click cab
The NetJets of Limos
Cabs2.0
23
Visuals: One small raster logo at top-left, 26 by 6 pixels, showing the pixelated wordmark 'UberCab' in dark grey and black letterforms on white, rendered at low resolution; it is not cropped, boxed or tinted. No charts, photographs, diagrams or other graphics.
Slide 24
Location-Based Service
UberCab
Extend infrastructure to other LBS applications
Delivery, non-critical medical/governmental use
Quarterly worldwide smartphone sales by OS vendor
million units shipped
Symbian
Linux
Access
Microsoft
RIM
Apple
Others
2005
2006
2007
Q3 smartphone sales by OS vendor by region
EMEA
Japan
China
N. AM.
ROW
Source: Canalys
Growing to a $3.5B industry by 2010
24
Visuals: One image: a two-part bar chart on white, centred horizontally at about x 36.7% to 60.9% and y 39.3% to 75.8% of the slide. Top chart: title 'Quarterly worldwide smartphone sales by OS vendor' in small blue italic type; vertical axis 'million units shipped' with ticks 0.0, 5.0, 10.0, 15.0, 20.0, 25.0, 30.0, 35.0; horizontal axis quarters Q1 to Q3 grouped under years 2005 (Q1 to Q4), 2006 (Q1 to Q4), 2007 (Q1 to Q3); eleven stacked columns. Series colours: Symbian orange, Linux red, Access light blue, Microsoft green, RIM black, Apple purple, Others yellow. Values are not printed; approximate totals are about 9, 10, 12, 15, 16, 18, 18, 20, 21, 25, 30 million units from Q1 2005 to Q3 2007, with Symbian forming the largest orange base (about 7 million in Q1 2005 rising to about 21 million in Q3 2007). Legend sits at the top left inside the plot. Bottom chart: title 'Q3 smartphone sales by OS vendor by region' in small blue italic type; vertical axis 0% to 100% in 10% steps; five 100% stacked columns labelled EMEA, Japan, China, N. AM., ROW, with a source line 'Source: Canalys' under the left of the axis. Estimated shares: EMEA about 87% Symbian, about 4% Linux, about 3% Microsoft, about 6% RIM; Japan about 69% Symbian, about 31% Linux; China about 58% Symbian, about 38% Linux, about 4% Microsoft; N. AM. about 1% Linux, about 5% Access, about 24% Microsoft, about 35% RIM, about 35% Apple; ROW about 84% Symbian, about 8% Linux, about 4% Microsoft, about 4% RIM. No highlighted points. Small logo at upper left: a pixelated grey-black wordmark reading 'UberCab', about 8% of slide width, not cropped.
Slide 25
Progress to Date / Ubercab.com reserved + “ubercab” SMS code / California LLC + trademark filed / Iphone dev license applied for Nov28,08 / Bank Account + Paypal account created / 5 advisors & 15 clients now recruited / Provisional patent filed / NEXT: buy 3 cars, develop app, Feb1st demo / – Raise a few million, small-office + GM in SF / 25
Visuals: A small low-resolution raster image of the word 'UberCab' in dark grey and black pixels, about 26 by 6 pixels, placed at the top left as a logo, rendered in a boxed, unframed, non-cropped form with no overlay. No charts, photographs or other illustrations.
Download this deck
The hosted PDF of every library deck is free for readers of the SlideDeck Co newsletter. Join with your email and the viewer and download appear here.
Building a pitch deck of your own? The SlideDeck Co Startup Deck is a slide library with a worked investor pitch and financial model.