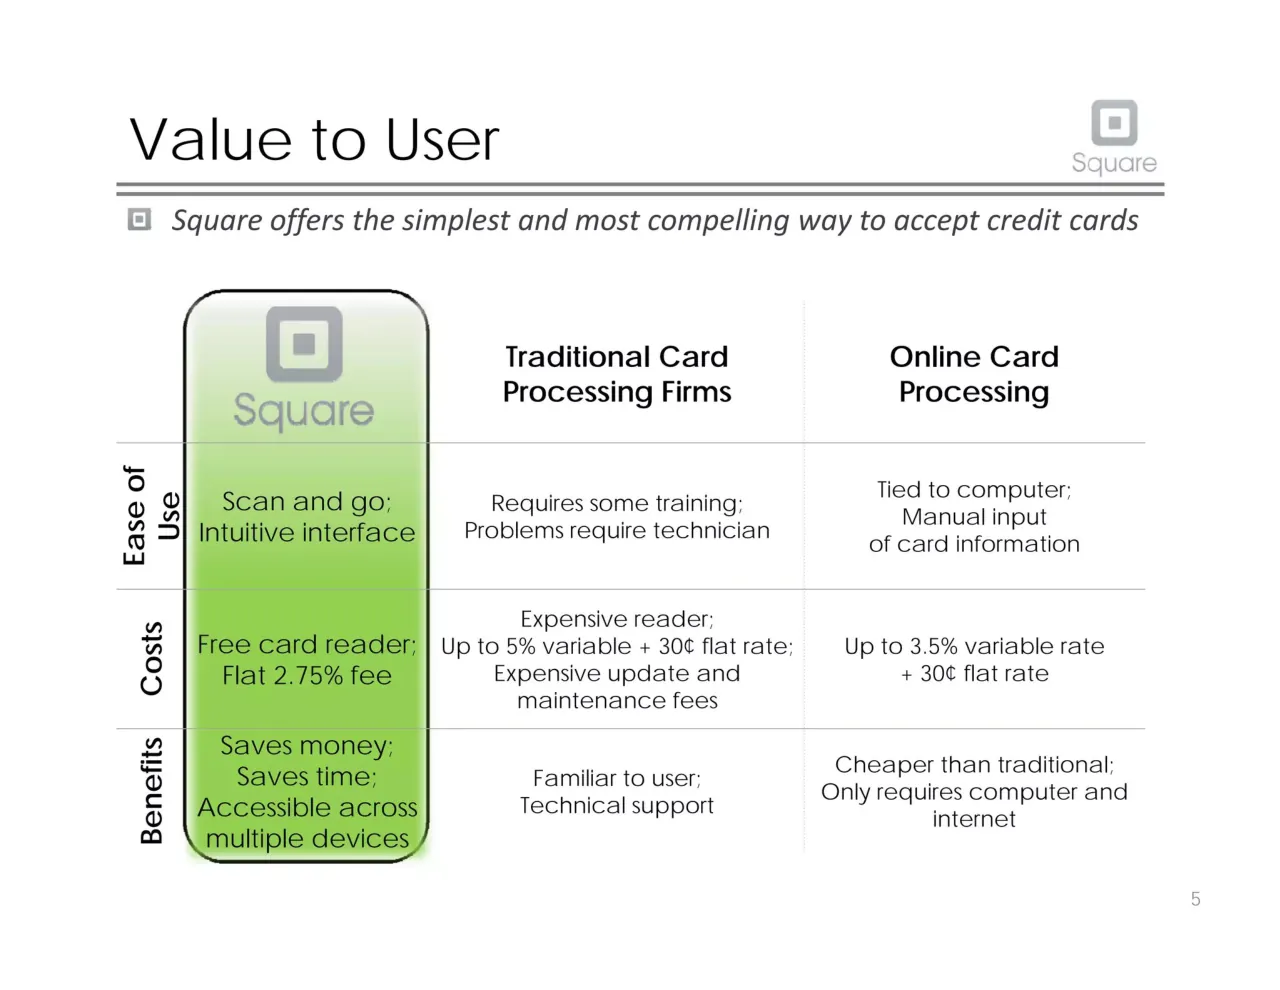
The deck opens with a title slide and then a one-page proposition covering market size, management, pricing, business model and defensibility. It then runs through the management team, the mobile payments market, the product and its technology, the value offered to users versus traditional and online card processing, and customer acquisition plans. Competition and defensibility come next, followed by a financial model with projections and an investment case with proposed funding rounds. It closes with exit strategies, covering M&A prospects and a potential IPO. An appendix holds financial assumptions, comparable company margins, valuation multiples, responses to investor concerns, partnerships, vision and market analysis. Slides worth studying include the market slide, which pairs a growth chart with opportunity, market change and positioning columns, the value comparison table on slide 6, and the financial scenarios on slide 9. The deck relies on tables, charts and short headline-style titles, and most slides carry one argument.
Slides worth studying
Questions about this deck
What does the Square deck say about the size of the mobile payments market?
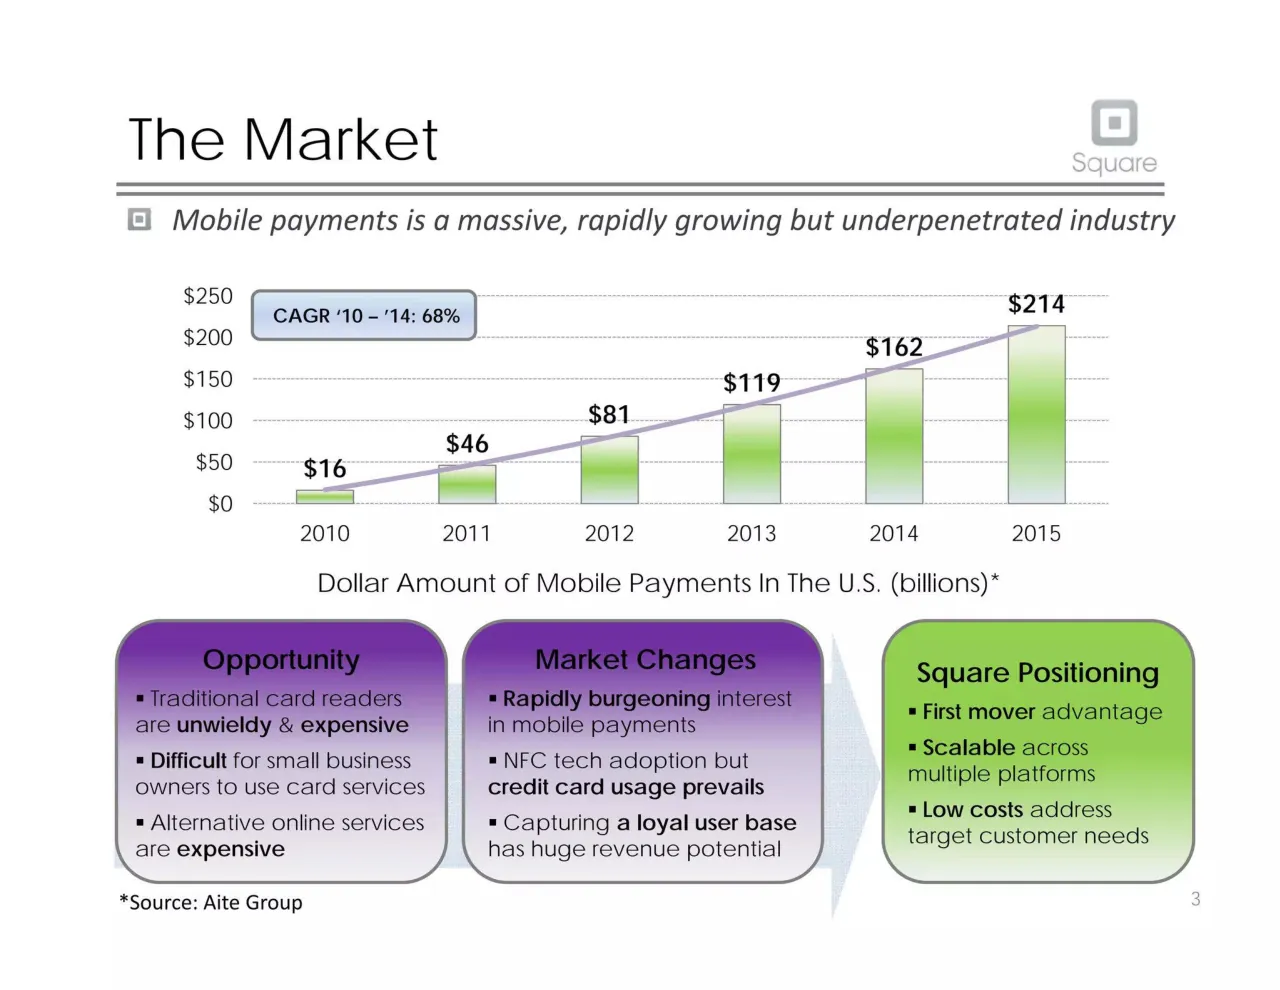
Slide 4 describes mobile payments as a massive, rapidly growing but underpenetrated industry. Its chart, sourced to the Aite Group, shows U.S. mobile payments rising from $16 billion in 2010 to $214 billion in 2015, with a CAGR of 68% for 2010 to 2014.
What is Square's pricing according to the Square deck?
Slide 2 lists simple pricing of 2.75% per swipe, with a free iPhone, iPad, Android app and card reader. Slide 6 repeats this, stating a free card reader and a flat 2.75% fee, compared with up to 5% variable plus 30¢ flat rate for traditional card processing firms.
How many slides does the Square deck have and how is it structured?
The Square deck has 20 slides. Slide 12 is the Appendix index, and the appendix covers financial assumptions, comparable company margins, valuation perspective, concerns and responses, partnerships, company vision and market analysis.
What financial projections does the Square deck show?
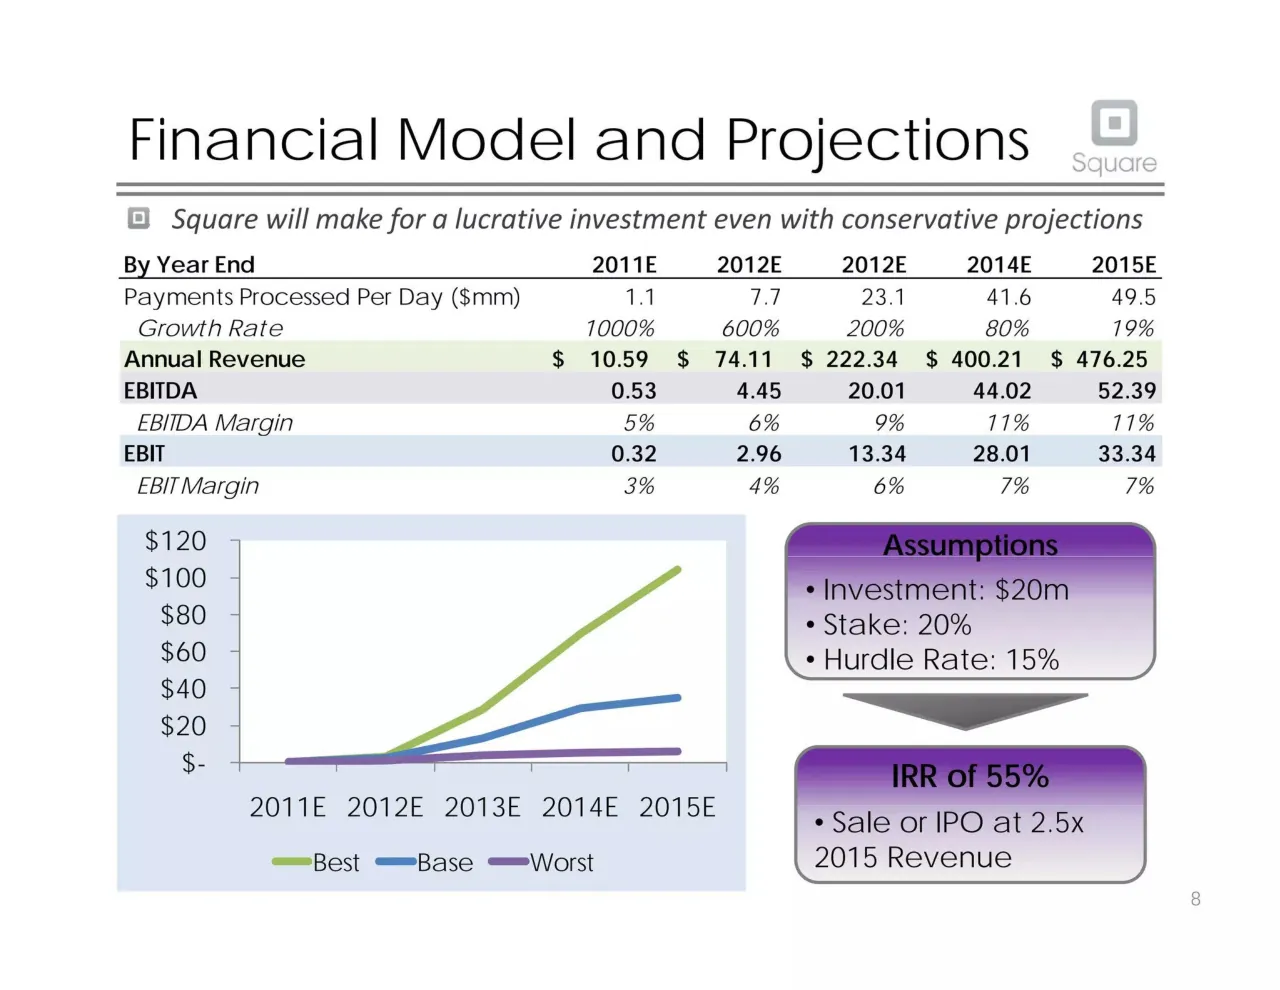
Slide 9 projects annual revenue rising from $ 10.59 in 2011E to $ 476.25 in 2015E, with EBITDA of 52.39 in 2015E. Its assumptions include a $20m investment, a 20% stake, a 15% hurdle rate, an IRR of 55%, and a sale or IPO at 2.5x 2015 revenue.
Details
Review score: 6 out of 10, Needs substantial work
Presentation quality, judged with the SlideDeck Co review heuristic. Ask, evidence and idea merit are not rated here.
The route is clear and conventional: proposition, team, market, product, value, acquisition, competition, financials, why invest now, exit, then a labelled appendix. Most slides carry one argument under a sentence-style subtitle, and the market chart (4), comparison table (6) and scenario slide (9) are readable and well structured. The 2011 template is dated and heavy: purple and green gradient boxes, bevelled shapes, a 3D bar chart on slide 10, and a table of 10 point text on slides 15 and 16. The chart on slide 9 has no data labels, the column header 2012E appears twice, and the appendix financial slides are dense tables with little emphasis, so the reader has to work to find the point.
Worth keeping: Keep the route and the short subtitle under each title, the market chart with its three-column read-out on slide 4, and the Square-highlighted column on the comparison table on slide 6.
Most useful repair: Fix the repeated 2012E header on slide 9, label the scenario chart lines and end points, and enlarge or trim the comparables tables on slides 15 and 16 so one takeaway stands out.
What would change the score: Replace the gradient and bevel styling with a flat, restrained palette, give the title slide a real image or product shot, and swap the 3D funding chart on slide 10 for a plain labelled one.
Confidence medium. 20 of 20 pages inspected on contact sheets, 4 at readable size. Reviewed 2026-11-08. Model-assisted review (claude-sonnet-5-5).
Full text of the slides (20 slides)
Every slide's words and a description of its charts and images, so the deck can be searched and rebuilt. Also available as Markdown.
Slide 1
Square
The Simplest Way to Make Money
Elizabeth Cheng | Jing-Jing Li | Irwin Liu | Jessica Lukrich
Visuals: Logo: the Square wordmark, the lowercase-style sans-serif word 'Square' in grey with a gradient from about #9A9A9A to #B8B8B8, with the Square brand icon (a rounded-corner square outline with a small filled square at its centre) at its top right. The 'q' descender extends down through the upper rule. Two thin horizontal grey rules, each about 0.3% of slide height thick, colour about #A6A6A6, running the full content width at about 72.4% and 74.3% of slide height. No photographs, charts or other graphics.
Slide 2
The Square Proposition
Huge market / opportunity / in mobile / payments
Inspiring and / experienced / management / team
Solid / business / model with / high revenue / generation
Defensible / business and / strong / execution / strategy
High future / valuation / and ROI / even with / later stage / investment
Simple pricing: / 2.75% per swipe
Zero friction: no / commitment and / daily deposit
Free iPhone, iPad, / Android app and / card reader
The simplest way / to make money
Square
1
Visuals: Shape group: four light grey block arrows with thin dark grey outlines arranged clockwise in a circle. Top arrow points right from the Huge market label toward the Inspiring label. Right arrow points down toward Solid business. Bottom arrow points left toward Defensible business. Left arrow points up toward High future valuation. Photo: a blue VISA credit card (shown with chip edge and printed number 0102 8195 4E21 partly visible) held by a hand, with a white Square card reader plugged into the bottom of an iPhone held in a second hand; the iPhone screen shows a payment amount of $15.33 and a small profile photo. The photo has a soft white fade into the background, is not boxed, and shows a light-grey and white tone with blue card and black phone. Right column: four rounded rectangles with purple-to-white vertical gradients and grey outlines, each with a grey downward triangle between them. Logo: Square logo, a grey rounded square with a white inner square above the grey word 'Square'.
Slide 3
Management Team / The team has the background, proven track record and vision to succeed / Jack Dorsey – Co-Founder, CEO / ▪ Co-Founder, Chairman of Twitter / ▪ Advisor at Ustream / Keith Rabois – COO / ▪ VP of Strategy & Business Development for Slide / ▪ VP of Business & Corporate Development at LinkedIn / ▪ EVP of Business Development and Policy for PayPal / Bob Lee – CTO / ▪ Founder at Twubble / ▪ Software Engineer at Google / Jim McKelvey – Co-Founder / ▪ Owner at Mira / ▪ Co-founder at Third Degree Glass Factory / Successfully Managing / Other Key Advisors / Gideon Yu / Roelof Botha / Ryan Gilbert / Alyssa Milano / Greg Kidd / Andrew Rasiej / 2
Visuals: Four head-and-shoulders photographs, each inside a grey dashed-outline frame, stacked vertically in the left column and each followed by a solid grey right-pointing chevron arrow. Photo 1 (Jack Dorsey): man in dark suit, white shirt and black tie against a black background, facing camera with neutral expression, cropped to the head and shoulders, neutral studio lighting, colours black, white and skin tones. Photo 2 (Keith Rabois): black-and-white portrait of a smiling man in a dark crew-neck sweater against a pale background, slightly low-angle, head and shoulders. Photo 3 (Bob Lee): outdoor colour photo of a smiling man in a navy jacket holding a green bottle, with a blurred green and crowd background, daylight. Photo 4 (Jim McKelvey): low-resolution, blurred close-up of a man with short hair in a reddish shirt, cropped at the shoulders, warm tones. Logos in the right panel: red USTREAM.TV box with white letters; light-blue 'twitter' wordmark above a blue bird; blue 'LinkedIn' wordmark with a blue 'in' box; teal-and-grey 'MIRA' wordmark; PayPal logo in blue with a small progress bar beneath; magenta 'twubble' wordmark; multicoloured 'Google' wordmark; cyan 'slide' wordmark. Grey dashed horizontal separators sit between the bio blocks.
Slide 4
The Market
Square
Mobile payments is a massive, rapidly growing but underpenetrated industry
$250
$200
CAGR '10 – '14: 68%
$150
$214
$162
$119
$100
$81
$46
$50
$16
$0
2010
2011
2012
2013
2014
2015
Dollar Amount of Mobile Payments In The U.S. (billions)*
Opportunity
▪ Traditional card readers are unwieldy & expensive
▪ Difficult for small business owners to use card services
▪ Alternative online services are expensive
Market Changes
▪ Rapidly burgeoning interest in mobile payments
▪ NFC tech adoption but credit card usage prevails
▪ Capturing a loyal user base has huge revenue potential
Square Positioning
▪ First mover advantage
▪ Scalable across multiple platforms
▪ Low costs address target customer needs
*Source: Aite Group
3
Visuals: Bar chart with a trend line. Title: none printed beyond the caption 'Dollar Amount of Mobile Payments In The U.S. (billions)*'. Y axis: $0 to $250 in $50 steps, labelled with dollar values. X axis: years 2010 to 2015, categories. Series 1 (bars, green gradient fill, grey outline): 2010 $16, 2011 $46, 2012 $81, 2013 $119, 2014 $162, 2015 $214. Series 2 (line, lavender #B3A6D1, about 4 pt, smooth trend across bar tops): no values printed. Callout box: light blue gradient rounded rectangle reading CAGR '10 – '14: 68%, placed at top-left of plot area. Horizontal dashed grey gridlines at each $50 step. No legend. No highlighted points. Below the chart, a large grey arrow shape (light grey-blue #DDE3EC gradient) runs behind the three boxes, pointing right toward the Square Positioning box. Square logo: grey rounded square icon with inner square and the word Square beneath, grey #8C8C8C, top-right.
Slide 5
The Product
Square
Square satisfies buyers and vendors through an easy-to-adopt platform
Consumer Desires
Use credit cards
Swipe and go
Vendor Desires
Accept credit cards
Save on processing fees
Simple and intuitive interface
Designate amount
Swipe credit card
Enter tip and sign with finger on-screen
Transaction completed
The Technology
Transaction
Magnetic reader that plugs into headphone jack of smartphone
Data Conversion
Once card is swiped, data is converted into an audio signal
Information Processing
Processors route signal to Square software application
Transmission
Encrypted data sent through Wi-Fi or 3G to back-end servers
Communication
No info stored on devices, auto-communication with payment network
4
Visuals: Photograph of a black iPad showing a Square point-of-sale app with a $25.19 total and product rows (Cappuccino, Green Tea, Caramels, 9.5% sales tax) and a grid of coffee item tiles, a black iPhone in front showing a $25.19 keypad, and a partly visible Android-style smartphone at right; each device has a small white Square magnetic card reader plugged into its audio jack. Shot straight-on, full colour, neutral white studio background with soft reflections under the devices, not cropped. Right side: a large pale blue down-arrow shape behind four rounded purple button shapes forming a process flow from top to bottom.
Slide 6
Value to User
Square
Square offers the simplest and most compelling way to accept credit cards
Square
Traditional Card Processing Firms
Online Card Processing
Ease of Use
Scan and go; / Intuitive interface
Requires some training; / Problems require technician
Tied to computer; / Manual input / of card information
Costs
Free card reader; / Flat 2.75% fee
Expensive reader; / Up to 5% variable + 30¢ flat rate; / Expensive update and / maintenance fees
Up to 3.5% variable rate / + 30¢ flat rate
Benefits
Saves money; / Saves time; / Accessible across / multiple devices
Familiar to user; / Technical support
Cheaper than traditional; / Only requires computer and / internet
5
Visuals: Table with rounded highlighted column. Columns: (1) row labels, (2) Square column with logo header, (3) Traditional Card Processing Firms, (4) Online Card Processing. Rows: Ease of Use; Costs; Benefits. Cell values: Square / Ease of Use: Scan and go; Intuitive interface. Square / Costs: Free card reader; Flat 2.75% fee. Square / Benefits: Saves money; Saves time; Accessible across multiple devices. Traditional / Ease of Use: Requires some training; Problems require technician. Traditional / Costs: Expensive reader; Up to 5% variable + 30¢ flat rate; Expensive update and maintenance fees. Traditional / Benefits: Familiar to user; Technical support. Online / Ease of Use: Tied to computer; Manual input of card information. Online / Costs: Up to 3.5% variable rate + 30¢ flat rate. Online / Benefits: Cheaper than traditional; Only requires computer and internet. The Square column is highlighted by a rounded black-outlined rectangle with a white-to-green vertical gradient (top light, lower #8CD14F green) and a soft glow. Horizontal thin grey rules separate rows; a dotted vertical grey line separates the Traditional and Online columns. Square logo: grey rounded square with a centred darker square and the word Square beneath, in grey #9A9A9A.
Slide 7
Customer Acquisition
Through wide exposure, Square targets anyone that seeks easy payment
Target Customer
Small businesses, independent workers, individuals selling goods
Market: anyone who accepts payments
Square's Cost: gaining customer awareness + free card reader
Selling Points
Easy convenient everyday usage
No surprise fees
Adaptable across multiple devices
Advertisement
Social media and internet advertising
Traditional mediums with max exposure/min cost
Retail
Selling through online registration and Apple stores
Follows razor blade retail model
Acquiring 100,000+ customers per month
6
Visuals: Three house-shaped (pentagon, pointed roof) boxes: Selling Points (white fill, grey outline), Advertisement (light grey gradient fill, grey outline), Retail (purple gradient fill from deep purple #6A2BB0 at top fading to pale lilac #EDE6F3 at bottom, grey outline). A dashed grey horizontal divider line (double-dash pattern of short grey dashes, about #808080) runs under the Target Customer panel. A green rounded-rectangle bar (fill #92D050 fading to near white at bottom edge, grey outline about 2 px) holds the text Acquiring 100,000+ customers per month. An Apple logo (chrome-silver apple with bite, glossy grey-white, no background) sits above a photograph of a three-sided billboard in a city street (Times Square style): the photo shows the billboard panels printed with a Square card reader, a hand holding a phone and a card, and white/grey panels; surrounding buildings and street signage are visible at the bottom; daylight, slightly high-angled, full rectangular crop with a thin grey border, not full-bleed. A small Square logo (grey rounded square with inner square and the word Square beneath) is at top right. A small bullet icon (grey rounded square with inner square) precedes the subtitle.
Slide 8
Competition and Defensibility / Square / Its established presence and niche market give Square a competitive edge / Characteristics / Square / Advantages / Direct Competitors: / GoPayment, PAYware / Similar technology application / Higher fees and rates for certain options / Intuit or VeriFone service support / Established clientele as first mover / No credit check / No monthly fees / Device compatibility / Apple partnership / Emerging Market: / Near Field / Communications / Built-in hardware for phones / Potentially eliminate use of credit cards / Cross interaction with other phone apps / POS experience / Compatible across differing hardware / Unique market focus / Can integrate NFC technology / 7
Visuals: Four rounded boxes with bullet text (two columns by two rows), two green gradient column headers, two row-label boxes (light blue and purple gradients), two grey right-pointing triangular arrows (one per row, between the characteristics and advantages boxes), dashed grey horizontal and vertical dividers forming a cross, and logos: Intuit GoPayment logo (green and blue swoosh with the word GoPayment, Intuit wordmark above), a photograph-style image of a black smartphone showing a PAYware Mobile screen with a VeriFone card reader attached (phone upright, centred, white-blue background, boxed without border), Apple logo (silver-grey glossy apple, no text), Google wordmark (multicoloured blue, red, yellow, green letters), and the Square logo (grey rounded square with inner square and the word Square beneath). No charts or tables.
Slide 9
Financial Model and Projections
Square
Square will make for a lucrative investment even with conservative projections
By Year End 2011E 2012E 2012E 2014E 2015E
Payments Processed Per Day ($mm) 1.1 7.7 23.1 41.6 49.5
Growth Rate 1000% 600% 200% 80% 19%
Annual Revenue $ 10.59 $ 74.11 $ 222.34 $ 400.21 $ 476.25
EBITDA 0.53 4.45 20.01 44.02 52.39
EBITDA Margin 5% 6% 9% 11% 11%
EBIT 0.32 2.96 13.34 28.01 33.34
EBIT Margin 3% 4% 6% 7% 7%
$120
$100
$80
$60
$40
$20
$-
2011E 2012E 2013E 2014E 2015E
Best Base Worst
Assumptions
• Investment: $20m
• Stake: 20%
• Hurdle Rate: 15%
IRR of 55%
• Sale or IPO at 2.5x
2015 Revenue
8
Visuals: Table: columns By Year End, 2011E, 2012E, 2012E, 2014E, 2015E (header as printed, second 2012E repeated as printed). Rows: Payments Processed Per Day ($mm) 1.1, 7.7, 23.1, 41.6, 49.5; Growth Rate (italic) 1000%, 600%, 200%, 80%, 19%; Annual Revenue (bold, pale green row) $ 10.59, $ 74.11, $ 222.34, $ 400.21, $ 476.25; EBITDA (bold, pale grey-lilac row) 0.53, 4.45, 20.01, 44.02, 52.39; EBITDA Margin (italic) 5%, 6%, 9%, 11%, 11%; EBIT (bold, pale blue row) 0.32, 2.96, 13.34, 28.01, 33.34; EBIT Margin (italic) 3%, 4%, 6%, 7%, 7%. Line chart: title none printed; y-axis $- to $120 in $20 steps (no unit label beyond dollar sign); x-axis categories 2011E to 2015E. Series Best (green line, about $0 in 2011E, about $4 in 2012E, about $29 in 2013E, about $71 in 2014E, about $106 in 2015E), Base (blue line, about $0, $4, $14, $30, $35), Worst (purple line, about $0, $1, $4, $6, $7). No values are printed on the chart; figures are estimates. Legend at bottom below x-axis: green Best, blue Base, purple Worst, horizontal. Small logo: grey rounded square with a white inner square at top right, with grey wordmark Square below. Small grey square bullet icon before subtitle. Down-pointing grey triangle arrow between the Assumptions box and IRR box.
Slide 10
Why Invest Now
Square
Additional investment will generate outsize returns due to growth prospects
Need for Additional Investment
High Potential for Growth
Additional resources / needed to maintain / first mover advantage
Competitive pressures / increasing
Expected spend in / advertising and / customer acquisition
Potential for growth will / allow new investors to / see an outsized return
Customer adoption will / scale up exponentially
The key to success will / be in locking in a loyal / customer base early
$27.5
$10.0
$20.0
* Additional / capital from / Sequoia and / new investor / consortium
Series A
Series B
Proposed / Series C
9
Visuals: A central 3D downward block arrow, medium gray gradient (#8C8C8C to #B5B5B5), pointing from the header zone down to the chart, with its tip just above the tallest bar. Behind the two bullet columns is a light gray (#EFEFF1) trapezoid panel, wider at top, narrowing toward the bottom. Below is a 3D column chart (type: column chart with three bars, drawn in a 3D perspective on a light gray floor outline with a thin gray baseline and tick marks). Series: Series A $10.0 (light blue-gray column, value printed $10.0, label inside the front face near the base); Series B $27.5 (tallest column, light blue front #D5EEF7, value printed $27.5 inside upper front face); Proposed Series C $20.0 (pale yellow-green column #EFF2DE, value printed $20.0 in bold). No axis scale, axis titles or legend are printed. The Proposed Series C category label is highlighted in a green rounded box. Small bullet icons (gray square with white inner square) precede the subtitle and each bullet item. The Square logo at top right is a gray rounded square with a centred inner square and the word Square below it in light gray.
Slide 11
Exit Strategies
Square will have multiple exit opportunities that will result in a high ROI
Highly Viable M&A Prospects
IPO Considerations
▪ Multiple buyers possible → competitive bidding
▪ Valuable user base with recurring revenue stream
▪ Clear fit into product portfolios
▪ Depends on user base expansion success and consideration of M&A
▪ High standalone potential
Large Companies Competing in Mobile Space
Apple
Microsoft
Potential Valuation
Service Providers and Hardware Manufacturers
verizon
HTC smart mobility
at&t
Rev
$700mm-$1.4bn
EBITDA
$450mm-$800mm
$400 $700 $1000 $1300 $1600
($mm)
Payment Processors
VISA
AMERICAN EXPRESS
ebay
10
Visuals: Chart: floating horizontal range bars (bar chart) with no chart title, placed in the lower right quadrant. Horizontal x-axis labelled ($mm) with ticks $400, $700, $1000, $1300, $1600 spaced unevenly across roughly 1368 to 1805 px of the slide width. Two categories on the vertical axis: Rev and EBITDA. Series 1, Rev: one light blue bar labelled $700mm-$1.4bn, spanning about $700mm to $1.4bn (bar starts near the $700 tick and ends near the $1300 tick). Series 2, EBITDA: one light blue bar labelled $450mm-$800mm, spanning about $450mm to $800mm (starts just right of the $400 tick and ends just before the $1000 tick). Bars are pale blue gradient fills with a thin grey-blue border, no legend and no highlighted points. Logos: Google wordmark in multicoloured letters (blue, red, yellow, green) on the top-left row; Apple logo in silver-grey glossy style; Microsoft four-colour flag with the wordmark below in dark grey bold italic. Second row: Verizon wordmark in red with a red check-mark swoosh; HTC logo in dark grey with green arrow shapes and the words smart mobility underneath; AT&T globe in blue with the at&t wordmark in grey. Third row: VISA wordmark in navy italic bold on a white field inside a navy border with an orange bottom band; American Express logo as white text on a blue rectangle; eBay wordmark in red, blue, yellow and green letters. Grey down-pointing solid triangles (arrows) sit under the left bullet box and under the right bullet box, pointing down into the green boxes. A vertical dashed grey line runs down the middle. Horizontal thin grey rules separate the three left rows.
Slide 12
Appendix / Index of Presentation and Appendix Slides / Presentation Slides / Appendix Slides / 1. The Square Proposition / 2. Management Team / 3. The Market / 4. The Product / 5. Value to User / 6. Customer Acquisition / 7. Competition and Defensibility / 8. Financial Model and Projections / 9. Why Invest Now / 10. Exit Strategies / Financial Assumptions / Financial Model / Assumptions from Comparables / Future Valuation Perspective / Concerns and Responses / Partnerships / Company Vision / Market Analysis / Pay with / Square / Discover / Novus / VISA / MasterCard / American Express Cards
Visuals: Four-logo strip with a Square payment graphic: a Pay with Square lockup (grey italic Pay with above a dark grey rounded-square icon and grey Square wordmark) above a row of four boxed card logos in order: Discover/Novus (black and orange with white text), VISA (blue and yellow), MasterCard (orange circles on red), American Express Cards (blue box with white text). Also a small grey square bullet icon beside the subtitle and a Square logo at top right (grey rounded square with inner square and grey Square wordmark). No charts or photographs.
Slide 13
Financial Assumptions / Growth expected to scale exponentially and valuation will increase / MODEL / DRIVERS / Growth Assumptions / Expected to process $40 million in transactions in Q1 of 2011 / Currently signing up 100,000 merchants per month / Compare to 30,000 monthly signups last Fall. / $1 million in payments per day / Processing a few million in mobile transactions per week as of last fall / Valuation Assumptions / Valued at $240m after last round of funding in January 2011 ($27.5m) / Valued at $40m at first round of funding in December 2009 ($10.0m) / Sources / DealBook, TechCrunch, Wall Street Journal, VentureBeat, Capital IQ / Square
Visuals: Logo: Square logo at top-right, a grey rounded square with a small inner square above the word 'Square' in grey. Decorative bullet icon: small grey square-in-square marker before the subtitle. Vertical panel labelled MODEL DRIVERS with letters stacked in two columns (M-O-D-E-L in left column, D-R-I-V-E-R-S in right column). Three rounded-rectangle outlined boxes containing text bullets; no charts, photos or tables.
Slide 14
Financial Model / Square / By Year End 2011E 2012E 2012E 2014E 2015E / Payments Processed Per Day ($mm) 1.1 7.7 23.1 41.6 49.5 / Growth Rate 1000% 600% 200% 80% 19% / Annual Revenue $ 10.59 $ 74.11 $ 222.34 $ 400.21 $ 476.25 / EBITDA 0.53 4.45 20.01 44.02 52.39 / EBITDA Margin 5% 6% 9% 11% 11% / EBIT 0.32 2.96 13.34 28.01 33.34 / EBIT Margin 3% 4% 6% 7% 7% / Growth Assumptions 2011E 2012E 2013E 2014E 2015E / Best Case 1000% 800% 400% 100% 50% / Base Case 1000% 600% 200% 80% 19% / Worst Case 1000% 200% 100% 20% 5% / EBIT 2011E 2012E 2013E 2014E 2015E / Best $ 0.32 $ 3.34 $ 28.59 $ 69.56 $ 104.34 / Base $ 0.32 $ 2.59 $ 13.34 $ 29.22 $ 34.77 / Worst $ 0.32 $ 1.11 $ 3.81 $ 5.56 $ 5.84 / NPV & IRR Calculation 2011E 2012E 2013E 2014E 2015E Sale / $ (20.00) $ 0.06 $ 0.52 $ 2.67 $ 5.84 $ 6.95 $ 238.12 / NPV @ 15% $ 79.95 / IRR 55% / * represents 20% stake
Visuals: Three financial tables and one summary block, no charts or photographs. Main table: columns are row label, then five year columns headed 2011E, 2012E, 2012E, 2014E, 2015E; rows are Payments Processed Per Day ($mm) 1.1 / 7.7 / 23.1 / 41.6 / 49.5; Growth Rate (italic) 1000% / 600% / 200% / 80% / 19%; Annual Revenue (bold, dollar-prefixed) $10.59 / $74.11 / $222.34 / $400.21 / $476.25; EBITDA (bold) 0.53 / 4.45 / 20.01 / 44.02 / 52.39; EBITDA Margin (italic) 5% / 6% / 9% / 11% / 11%; EBIT (bold) 0.32 / 2.96 / 13.34 / 28.01 / 33.34; EBIT Margin (italic) 3% / 4% / 6% / 7% / 7%. Highlight bands: Annual Revenue row pale green, EBITDA row light lavender grey, EBIT row pale blue. Growth Assumptions table: columns 2011E, 2012E, 2013E, 2014E, 2015E; rows Best Case 1000% / 800% / 400% / 100% / 50%; Base Case 1000% / 600% / 200% / 80% / 19%; Worst Case 1000% / 200% / 100% / 20% / 5%. EBIT scenario table: columns 2011E to 2015E; rows Best $0.32 / $3.34 / $28.59 / $69.56 / $104.34; Base $0.32 / $2.59 / $13.34 / $29.22 / $34.77; Worst $0.32 / $1.11 / $3.81 / $5.56 / $5.84 (all italic). NPV and IRR block: pale green band; header row NPV & IRR Calculation with columns 2011E to 2015E and Sale; values row $ (20.00) / $ 0.06 / $ 0.52 / $ 2.67 / $ 5.84 / $ 6.95 / $ 238.12 in italic; NPV @ 15% value $ 79.95 in a black-outlined box, bold italic; IRR value 55% in a black-outlined box, bold italic; footnote * represents 20% stake in italic beside the IRR box. Logo: a grey rounded square with a smaller darker grey square inside, above the grey wordmark Square in a light geometric sans. Rules: two horizontal grey lines.
Slide 15
Assumptions from Comparables
Square
Margin projections derived from median of comparable companies
Company Name / LTM Gross Margin % / LTM EBITDA Margin % / LTM EBIT Margin % / LTM Net Income Margin % / LTM Total Revenues, 1 Yr Growth %
Ebay Inc. 72.0% 31.0% 22.7% 19.7% 4.9%
Gerber Scientific Inc. 30.7% 4.5% 2.9% (3.0%) 21.0%
Iltron Inc. 30.9% 14.0% 8.2% 4.6% 33.9%
Iteris Inc. 43.5% 8.3% 6.4% (8.3%) (1.2%)
Mastercard Incorporated 100.0% 53.3% 50.7% 33.3% 8.6%
PAR Technology Corp. 26.1% 2.7% 1.6% 1.3% 7.6%
Perceptron Inc. 37.3% 0.8% (1.0%) 1.9% 30.4%
VeriFone Systems Inc. 37.7% 14.8% 11.3% 11.3% 24.3%
Veritec Inc. 60.8% (64.2%) (67.8%) (86.5%) 108.0%
Visa Incorporated 84.4% 60.0% 56.8% 37.0% 17.0%
Summary Statistics / LTM Gross Margin % / LTM EBITDA Margin % / LTM EBIT Margin % / LTM Net Income Margin % / LTM Total Revenues, 1 Yr Growth %
High 100.0% 60.0% 56.8% 37.0% 108.0%
Low 26.1% (64.2%) (67.8%) (86.5%) (1.2%)
Mean 52.3% 12.5% 9.2% 1.1% 25.5%
Median 40.6% 11.2% 7.3% 3.3% 19.0%
Visuals: Two tables with no chart. Table 1 has 6 columns: Company Name, LTM Gross Margin %, LTM EBITDA Margin %, LTM EBIT Margin %, LTM Net Income Margin %, LTM Total Revenues 1 Yr Growth %. It has 10 company rows: Ebay Inc. 72.0%, 31.0%, 22.7%, 19.7%, 4.9%; Gerber Scientific Inc. 30.7%, 4.5%, 2.9%, (3.0%), 21.0%; Iltron Inc. 30.9%, 14.0%, 8.2%, 4.6%, 33.9%; Iteris Inc. 43.5%, 8.3%, 6.4%, (8.3%), (1.2%); Mastercard Incorporated 100.0%, 53.3%, 50.7%, 33.3%, 8.6%; PAR Technology Corp. 26.1%, 2.7%, 1.6%, 1.3%, 7.6%; Perceptron Inc. 37.3%, 0.8%, (1.0%), 1.9%, 30.4%; VeriFone Systems Inc. 37.7%, 14.8%, 11.3%, 11.3%, 24.3%; Veritec Inc. 60.8%, (64.2%), (67.8%), (86.5%), 108.0%; Visa Incorporated 84.4%, 60.0%, 56.8%, 37.0%, 17.0%. Negative values are in parentheses. Table 2 has 6 columns with header Summary Statistics and the same five metric columns, and rows High 100.0%, 60.0%, 56.8%, 37.0%, 108.0%; Low 26.1%, (64.2%), (67.8%), (86.5%), (1.2%); Mean 52.3%, 12.5%, 9.2%, 1.1%, 25.5%; Median 40.6%, 11.2%, 7.3%, 3.3%, 19.0%. The Median row is set in a larger bold font. Cell grid is faint: thin vertical separators in light grey between metric columns in the lower table. A small grey square icon precedes the subtitle, and a grey rounded-square logo with the word Square sits top-right.
Slide 16
Future Valuation Perspective
Square
Square’s valuation would price at premium to multiples due to early stage
Company Name / TEV/Total / TEV/EBITDA LTM / TEV/EBIT LTM - / NTM / NTM / NTM Forward
Revenues LTM - / - Latest / Latest / TEV/Forward / TEV/Forward / P/E
Latest / Total Revenue / EBITDA
Ebay Inc. / 3.83x / 12.34x / 16.88x / 3.3x / 9.4x / 15.9x
Gerber Scientific Inc. / 0.49x / 10.95x / 16.80x / 0.5x / 7.9x / 21.9x
Iltron Inc. / 0.71x / 8.55x / 11.10x / 0.7x / 6.3x / 16.5x
Iteris Inc. / 1.18x / 8.47x / 14.51x / 1.2x / 7.7x / 13.0x
Mastercard Incorporated / 5.46x / 10.23x / 10.77x / 4.9x / 9.0x / 15.8x
PAR Technology Corp. / 0.29x / 10.73x / 17.98x / 0.3x / 7.9x / 23.7x
Perceptron Inc. / 0.53x / 67.04x / NM / 0.5x / 9.7x / 37.3x
VeriFone Systems Inc. / 4.49x / 30.27x / 39.89x / 4.0x / 19.3x / 29.6x
Veritec Inc. / 4.03x / NM / NM / - / - / -
Visa Incorporated / 6.12x / 10.21x / 10.80x / 5.5x / 8.6x / 15.3x
Summary Statistics / TEV/Total / TEV/EBITDA LTM / TEV/EBIT LTM - / NTM / NTM / NTM Forward
Revenues LTM - / - Latest / Latest / TEV/Forward / TEV/Forward / P/E
Latest / Total Revenue / EBITDA
High / 6.12x / 67.04x / 39.89x / 5.5x / 19.3x / 37.3x
Low / 0.29x / 8.47x / 10.77x / 0.3x / 6.3x / 13.0x
Mean / 2.71x / 18.75x / 17.34x / 2.3x / 9.5x / 21.0x
Median / 2.51x / 10.73x / 15.66x / 1.2x / 8.6x / 16.5x
Visuals: Two stacked data tables with no chart or photograph. Upper table, Company comparables: columns are Company Name, TEV/Total Revenues LTM - Latest, TEV/EBITDA LTM - Latest, TEV/EBIT LTM - Latest, NTM TEV/Forward Total Revenue, NTM TEV/Forward EBITDA, NTM Forward P/E. Rows: Ebay Inc. 3.83x 12.34x 16.88x 3.3x 9.4x 15.9x; Gerber Scientific Inc. 0.49x 10.95x 16.80x 0.5x 7.9x 21.9x; Iltron Inc. 0.71x 8.55x 11.10x 0.7x 6.3x 16.5x; Iteris Inc. 1.18x 8.47x 14.51x 1.2x 7.7x 13.0x; Mastercard Incorporated 5.46x 10.23x 10.77x 4.9x 9.0x 15.8x; PAR Technology Corp. 0.29x 10.73x 17.98x 0.3x 7.9x 23.7x; Perceptron Inc. 0.53x 67.04x NM 0.5x 9.7x 37.3x; VeriFone Systems Inc. 4.49x 30.27x 39.89x 4.0x 19.3x 29.6x; Veritec Inc. 4.03x NM NM - - -; Visa Incorporated 6.12x 10.21x 10.80x 5.5x 8.6x 15.3x. Lower table, Summary Statistics with the same seven columns: High 6.12x 67.04x 39.89x 5.5x 19.3x 37.3x; Low 0.29x 8.47x 10.77x 0.3x 6.3x 13.0x; Mean 2.71x 18.75x 17.34x 2.3x 9.5x 21.0x; Median 2.51x 10.73x 15.66x 1.2x 8.6x 16.5x. No chart, legend or highlighted points. The Square logo is a grey rounded-square icon with a small inner square above the grey wordmark Square. A small grey square bullet precedes the subtitle.
Slide 17
Concerns and Responses / Square / Concern / Response / NFC will overtake credit card use / Credit cards too engrained in daily life to become outdated in the near future / Large companies will leverage ability to provide at lower prices / Square has a different target audience and has the first mover advantage / Consumer concerns over security on a newly introduced platform / Partner bank verifies service and secure server makes security claims unfounded / Square will face execution risks / Square has a successfully run and experienced management team / No defining industry standard / Flexibility of the industry promotes innovation; a standard will soon be reached
Visuals: Logo: Square logo at top right, a grey rounded-square icon with a centred square hole above the grey word 'Square' in a light sans-serif. Five pairs of chevron shapes: left white chevrons with thin grey (#808080) outlines pointing right; right green chevrons with grey outlines and a green vertical gradient from near-white at top to bright green (#8DD14F) at bottom, pointing left. Each left chevron is paired with the right chevron in the same row. No chart, photo or diagram.
Slide 18
Partnerships / There are a multitude of partnership opportunities for Square / Present / Future / Sight Glass / Zappos.com / VIVIENNE TAM / Apple / JPMorgan / ebay / newegg.com / VISA / htc smart mobility / American Heart Association / Learn and Live / CISCO / craigslist
Visuals: Logo set, no photographs or charts. Present column, left to right and top to bottom: Sight Glass logo (brown circular badge with white outlined text 'sIGHt GLASS' in a monoline font, fill about #6B3A1E), Zappos.com logo (black bold 'Zappos' with light blue '.com' and a blue shoe icon, on a very pale grey-blue box #F4F6FA), Vivienne Tam wordmark (black bold uppercase 'VIVIENNE TAM'), Apple logo (silver-grey glossy apple outline with gradient #C8CED6 to #8A929C), JPMorgan logo (blue #2E5AAC octagonal mark with 'JPMorgan' in blue sans). Future column, left to right and top to bottom: ebay logo (red e, blue b, yellow a, green y, bold rounded), newegg.com logo (overlapping white, orange and grey ovals with navy italic 'newegg.com' and registered mark), VISA logo (navy #1A1F71 bar on top, gold #E8960C bar at bottom, white-outlined navy box with 'VISA' in bold italic navy on white), htc smart mobility logo (grey and green icon with dark grey 'htc' and 'smart mobility' beneath), American Heart Association logo (black serif 'American Heart Association' with red heart and torch icon, italic 'Learn and Live' beneath), CISCO logo (teal #0F7C8A bar-graph icon above red #D0202B bold 'CISCO' with trademark mark), craigslist logo (blue #2A3EB1 bold serif lowercase 'craigslist' on pale grey box #F5F6F9).
Slide 19
Company Vision
Square
Square: 0 to $60 in under 10 seconds
Target consumers are
small business
Free app for iPhone,
iPad & Android
Pay with
Square
DISCOVER NOVUS
VISA
MasterCard
AMERICAN EXPRESS Cards
Daily deposit to your
bank account
Simple pricing, free
shipping
The simplest way to
make money
Vision is to create zero friction and
complexity around payments
Emphasis on simplicity & efficiency
Visuals: Left-middle: a boxed image, about 27% wide and 20% high, with a thin black 1px border and white background, titled 'Pay with' in grey italic sans above a dark grey (#4D4D4D) rounded-square Square logo followed by the word 'Square' in dark grey sans-serif. Below, four card-brand logos in a row, left to right: Discover/Novus (red-orange and green card), VISA (white card with blue VISA wordmark and yellow stripe), MasterCard (red and orange circles on blue field), American Express Cards (blue box with white text). Right column: four grey down-pointing solid triangular arrows, each about 19% wide and 4% high, fill #808080, between the purple boxes. Connectors: two grey dashed elbow lines, stroke about 3px, colour #808080; the first runs from the bottom of the blue box down, across right, and down to the top of the image; the second runs from the bottom of the image down, across right, and down to the top of the green box. Small grey square bullet icons (about 2% wide, #A0A0A0 with a darker inner square) sit before the subtitle and each green-box bullet. Logos: Square app icon (grey rounded square with inner square) at top right with 'Square' wordmark below it.
Slide 20
Market Analysis
Square
Strong market growth and advantageous company position
Market
Expanding & unsaturated marketplace
Position
First Mover Advantage Few comparable competitors Currently underfunded
High growth potential
Competitors
Large Competitors
Ie. Google, Apple
Not focused enough to drive Square out of its niche market
Small Competitors
Ie. VeriFone, Intuit
Lack first mover advantage
Visuals: Three green gradient rounded rectangles connected by two grey right-pointing solid triangular arrows (chevron-style pointers) placed between boxes 1 and 2 and between boxes 2 and 3. A horizontal dashed grey divider line across the lower half. A grey rounded panel with a green rounded tab labelled Competitors overlapping its upper-left corner. A dashed vertical grey divider between the two competitor columns. Small grey square-in-square bullet icons precede the subtitle and each bullet item. A grey rounded-square Square logo icon with the word Square beneath it at top right. No chart, table, or photograph.
Download this deck
The hosted PDF of every library deck is free for readers of the SlideDeck Co newsletter. Join with your email and the viewer and download appear here.
Building a pitch deck of your own? The SlideDeck Co Startup Deck is a slide library with a worked investor pitch and financial model.