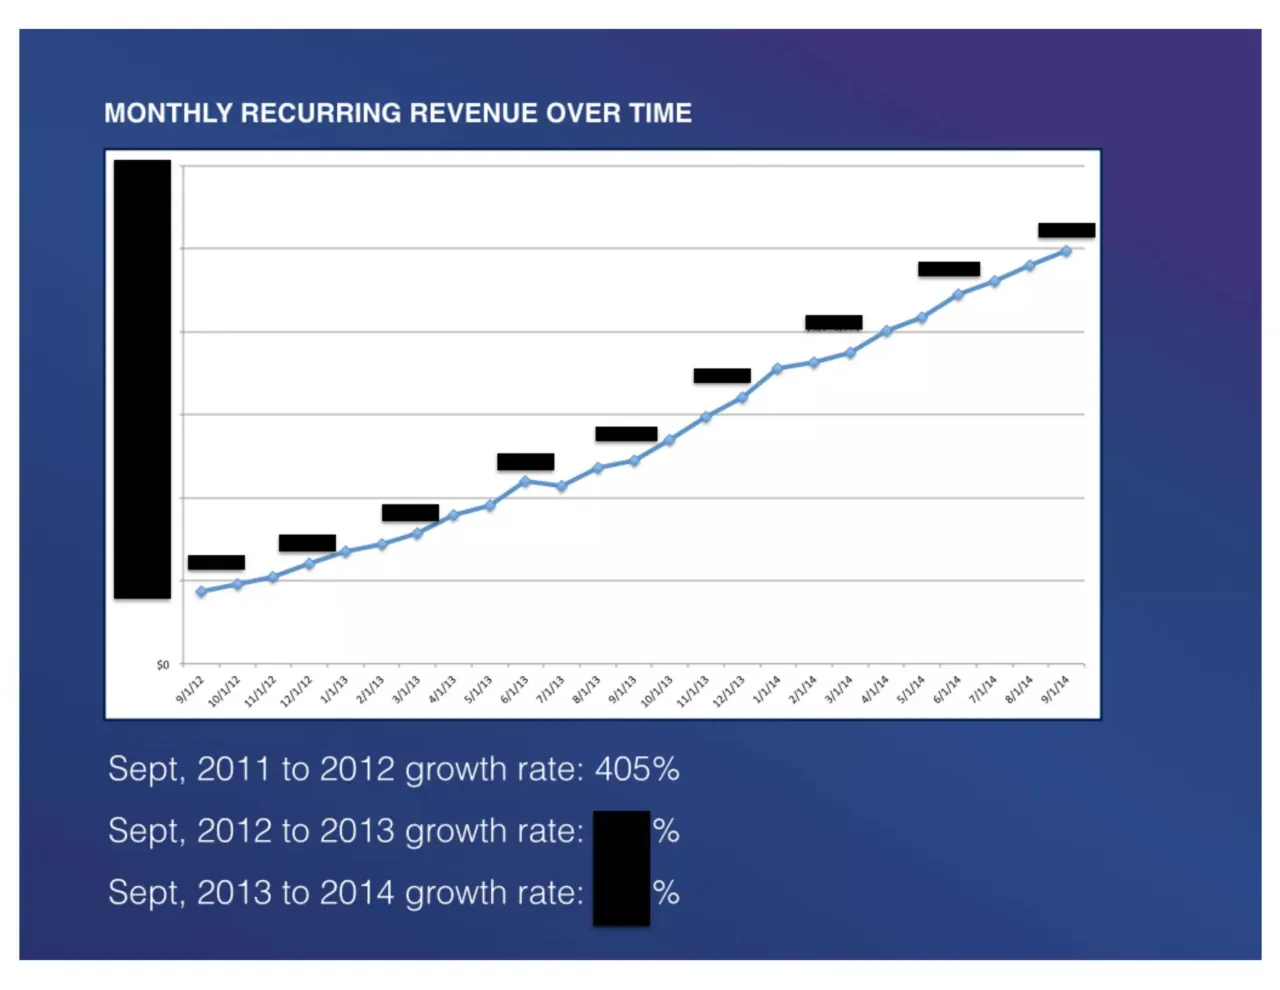
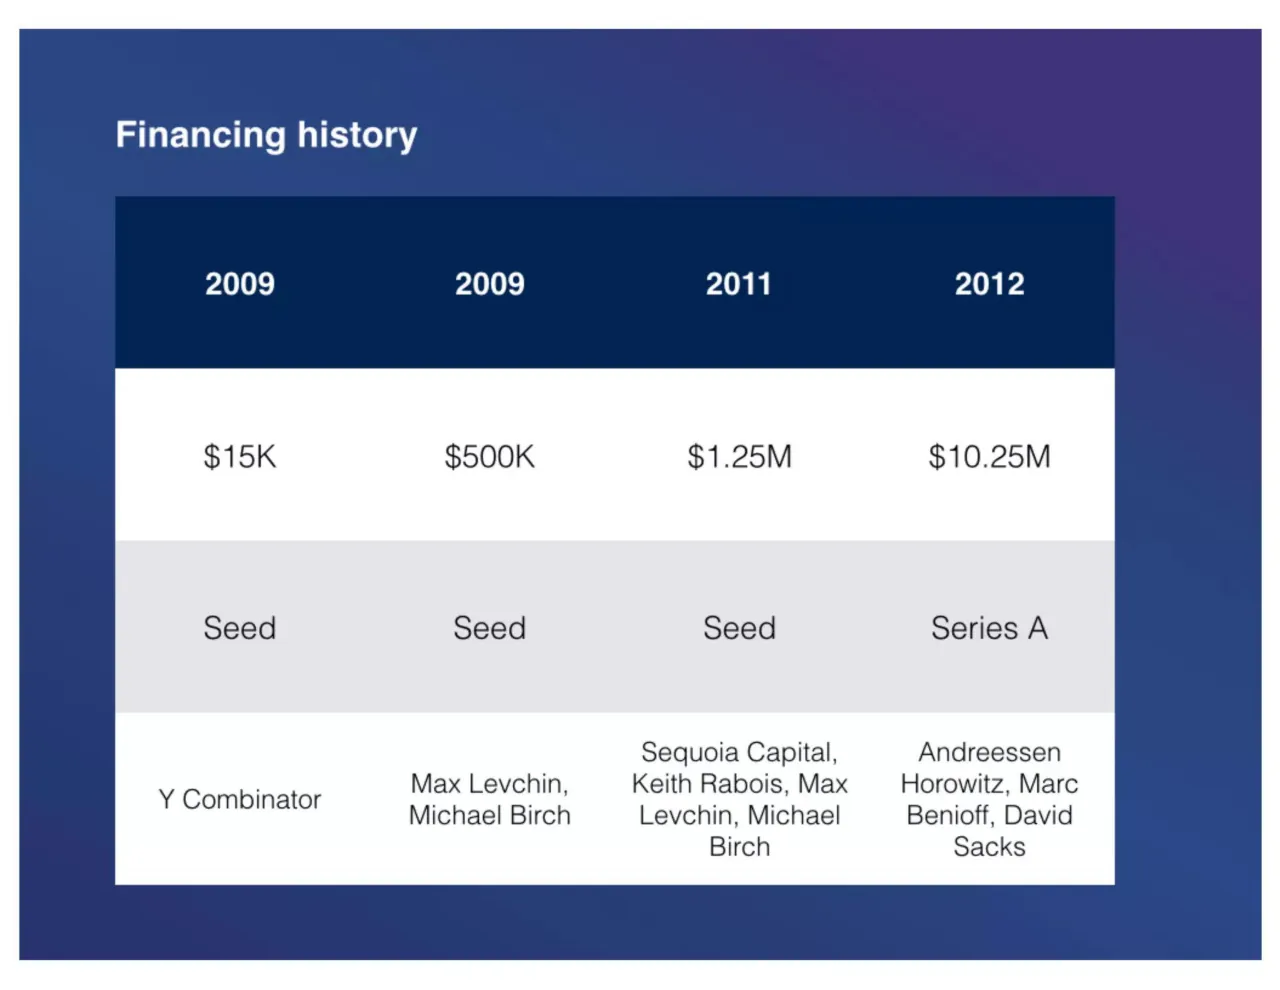
The deck opens with two problems: most people make decisions by guessing or by gut, and companies on mobile and web track vanity metrics such as page views and installs. It then presents Mixpanel as an analytics product for product and marketing teams, with a plan to expand into sales and finance and a mission to help the world learn from its data. The competitive advantage section points to a database engine built in 2010. Next comes a monthly recurring revenue chart over time with year-on-year growth rates, followed by a sales KPI slide and a marketing slide listing lead sources and spend. The expansion plan covers headcount growth, new leadership hires, and entry into New York and then international markets. A competition slide groups startups and incumbents by free and paid tiers. The deck closes with a financing history table listing seed rounds, a Y Combinator entry, and a Series A. Slides 7 and 8 are the most useful to study, since the chart and KPI layout show how numbers can carry a traction story rather than prose.
Review score: 6 out of 10, Needs substantial work
Presentation quality, judged with the SlideDeck Co review heuristic. Ask, evidence and idea merit are not rated here.
The deck has a clear, simple route (problem, solution, mission, advantage, traction, sales, marketing, plan, competition, financing) and a consistent blue gradient look, with large readable statements on slides 2 to 6. But the middle of the deck is dense, plain text with little hierarchy (slides 8, 9, 10), and the key traction chart on slide 7 has black redaction bars covering the axis, labels and many points, so the traction story the deck depends on cannot be read. Slides 2 to 6 are almost identical text-on-gradient pages with no image or product view, so the audience never sees what Mixpanel does, and the competition and financing slides are plain boxes and a table with no emphasis on the key figure.
Worth keeping: Keep the consistent gradient background, the small caps label above one large statement on slides 2 to 6, and the plain line chart with growth rates beneath it on slide 7.
Most useful repair: Show the chart with readable axis values or indexed scale and highlight the key growth figure, and break the bullet lists on slides 8 to 10 into a few emphasised numbers with clear grouping.
What would change the score: I would add at least one product screenshot or diagram after slide 4 and reduce the list slides to fewer, larger points with visual emphasis.
Confidence medium. 12 of 12 pages inspected on contact sheets, 4 at readable size. Reviewed 2026-11-08. Model-assisted review (claude-sonnet-5-5).
Full text of the slides (12 slides)
Every slide's words and a description of its charts and images, so the deck can be searched and rebuilt. Also available as Markdown.
Slide 1
mixpanel
Visuals: One logo: the Mixpanel wordmark in lowercase rounded geometric sans-serif letters, white, with a row of three white dots below the left part of the word, descending in size from large to medium to small, left to right. No photograph, chart or other graphic.
Slide 2
PROBLEM 1
Most of the world will make decisions by either guessing or using their gut. They will be either lucky or wrong.
Slide 3
PROBLEM 2
Companies on mobile & web are
measuring bullshit metrics like
page views and installs. It’s really
hard to be really sophisticated.
Slide 4
SOLUTION
Mixpanel has built analytics software for product and marketing. As we continue to penetrate organizations, we will build software for sales and finance next.
Slide 5
MISSION / Help the world learn from its data.
Slide 6
COMPETITIVE ADVANTAGE
In 2010, we built the most sophisticated analytics database engine to answer questions that existing technology could not answer. It’s the reason we are winning.
Slide 7
MONTHLY RECURRING REVENUE OVER TIME
$0
9/1/12 10/1/12 11/1/12 12/1/12 1/1/13 2/1/13 3/1/13 4/1/13 5/1/13 6/1/13 7/1/13 8/1/13 9/1/13 10/1/13 11/1/13 12/1/13 1/1/14 2/1/14 3/1/14 4/1/14 5/1/14 6/1/14 7/1/14 8/1/14 9/1/14
Sept, 2011 to 2012 growth rate: 405%
Sept, 2012 to 2013 growth rate: [redacted] %
Sept, 2013 to 2014 growth rate: [redacted] %
Visuals: One line chart titled MONTHLY RECURRING REVENUE OVER TIME. X axis: monthly categories from 9/1/12 to 9/1/14 (25 labels, tick labels rotated about 30 degrees, dark grey). Y axis: only the label $0 is printed at the baseline; the other gridlines are unlabelled, so values are given only as about estimates in unlabelled gridline units: the series starts about 0.9 at 9/1/12 and rises to about 5.0 at 9/1/14, with a small dip near 7/1/13. Single series drawn as a light blue line (#6A9BD8) with diamond markers (light blue #8DB8E8). Seven horizontal light grey gridlines (#C8C8C8). No legend. Several opaque black rectangles (#000000) cover parts of the chart, covering the data labels and the axis area at the left. No highlighted points other than the markers.
Slide 8
Sales KPIs
2015 target: [redacted]% YoY growth - [redacted]M (conservative), 63 sales reps
Avg revenue per customer: $[redacted]/mo; we have a wide distribution
Leads per month: [redacted]; 26% of new customers are touched by sales
New customers per month: [redacted]; 4x spend in 5 months,[redacted]x in 12 months
Avg monthly revenue churn rate: [redacted]%, [redacted]% in Sept.
Started 2014 with 5 quota carrying sales reps, will end with 33
Sales payback rate is around 6 months; we will get this down in 2015
Visuals: None apart from eight solid black rectangles that redact numeric values in the body lines. Each black block sits over the text it hides: in line 1 over the target percentage and the revenue figure, in line 2 over the dollar amount, in line 3 over the leads figure, in line 4 over the new customers figure and the multiplier, and in line 5 over both churn percentages.
Slide 9
Marketing
[redacted] leads - most are organically acquired
[redacted]% of customers that sign up will integrate
[redacted]% will become paid customers
Our best marketing programs are freemium usage, world-class customer support, PR, and education
August snapshot:
General: $36K
PR: $5K
Advertising: $42K
Total: $83K
Slide 10
2015/2016 expansion plan / 3x sales headcount and rapidly race towards distribution / Improve churn rates by expanding the CSM team by [redacted]x - reduce churn under [redacted]% per month / Reduce sales ramp time by 30-50% via sales enablement / Build out leadership team: CFO, HR, CMO / Expand customer facing teams like support, sales eng, etc. to accommodate new customers / Double headcount every 6-9 months / Double down on marketing to widen our lead flow to lower cost per acq. long-term / Expand into NY in 2015, international in 2016
Slide 11
Competition
Free
Paid
Startups
Flurry
KISSmetrics
Localytics
Upsight
Amplitude
Heap Analytics
Incumbents
Google Analytics
Omniture
Visuals: A 2x2 matrix diagram drawn as a single rounded square outlined in thin white (about 1.5 pt) with a white cross dividing it into four equal cells. Column headers: Free (left) and Paid (right). Row headers: Startups (top) and Incumbents (bottom). Cell contents: top-left Flurry; top-right KISSmetrics, Localytics, Upsight, Amplitude, Heap Analytics listed one per line; bottom-left Google Analytics; bottom-right Omniture. The cells are filled with the same blue as the background, so only the white outlines separate them. No photographs, charts, logos or icons.
Slide 12
Financing history
2009 / 2009 / 2011 / 2012
$15K / $500K / $1.25M / $10.25M
Seed / Seed / Seed / Series A
Y Combinator / Max Levchin, Michael Birch / Sequoia Capital, Keith Rabois, Max Levchin, Michael Birch / Andreessen Horowitz, Marc Benioff, David Sacks
Visuals: One table with 4 equal-width columns and 4 rows, no chart or images. Header row (dark navy #002050): 2009 / 2009 / 2011 / 2012, bold white. Row 2 (white #FFFFFF): $15K / $500K / $1.25M / $10.25M, regular dark text. Row 3 (light grey #E5E5EA): Seed / Seed / Seed / Series A. Row 4 (white #FFFFFF): Y Combinator / Max Levchin, Michael Birch / Sequoia Capital, Keith Rabois, Max Levchin, Michael Birch / Andreessen Horowitz, Marc Benioff, David Sacks, centred and wrapping to 2 to 4 lines. No borders visible; cells separated by fill colour only.