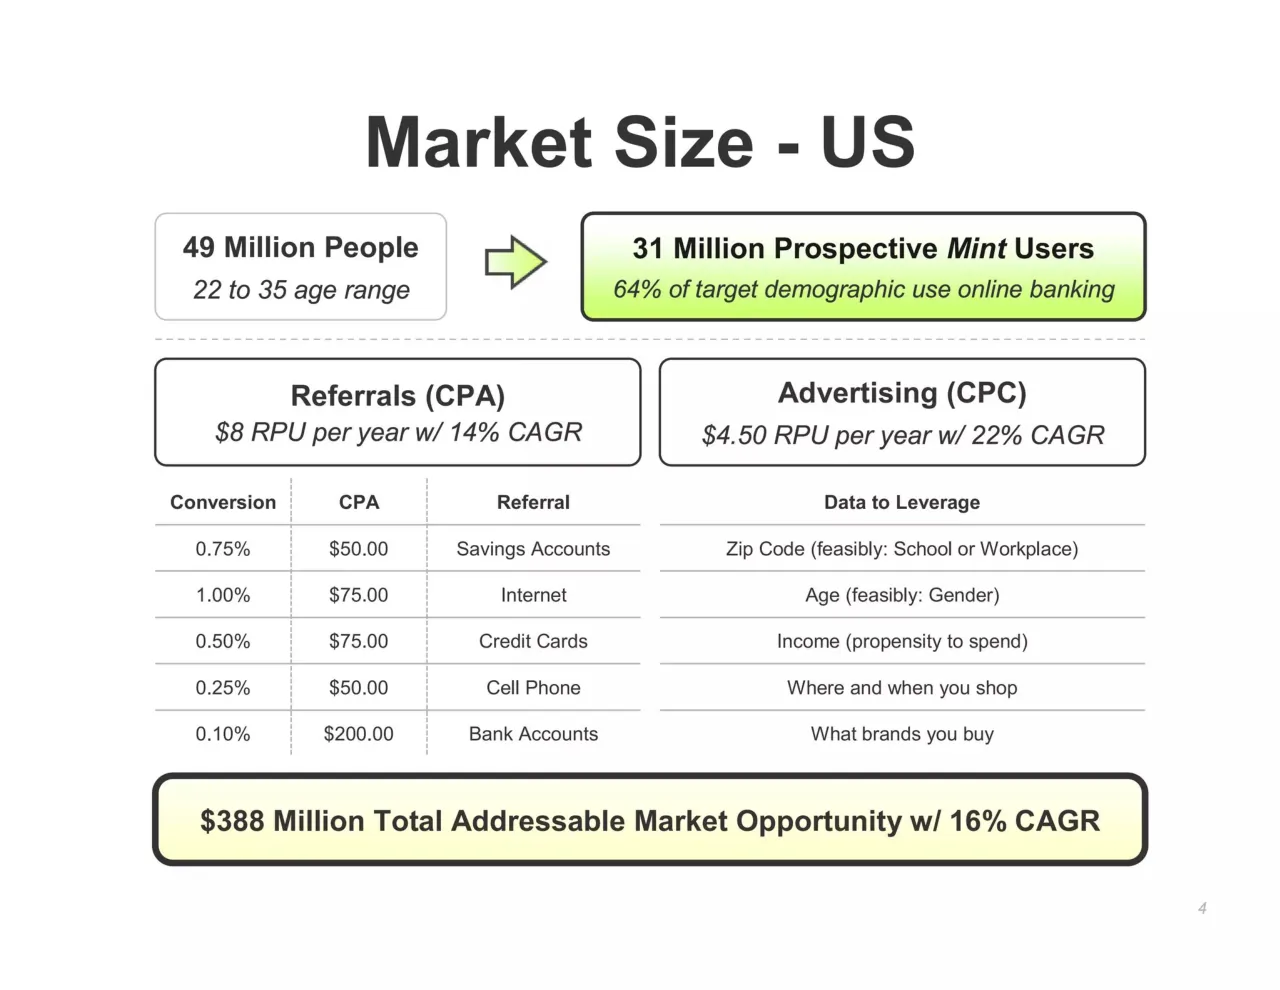
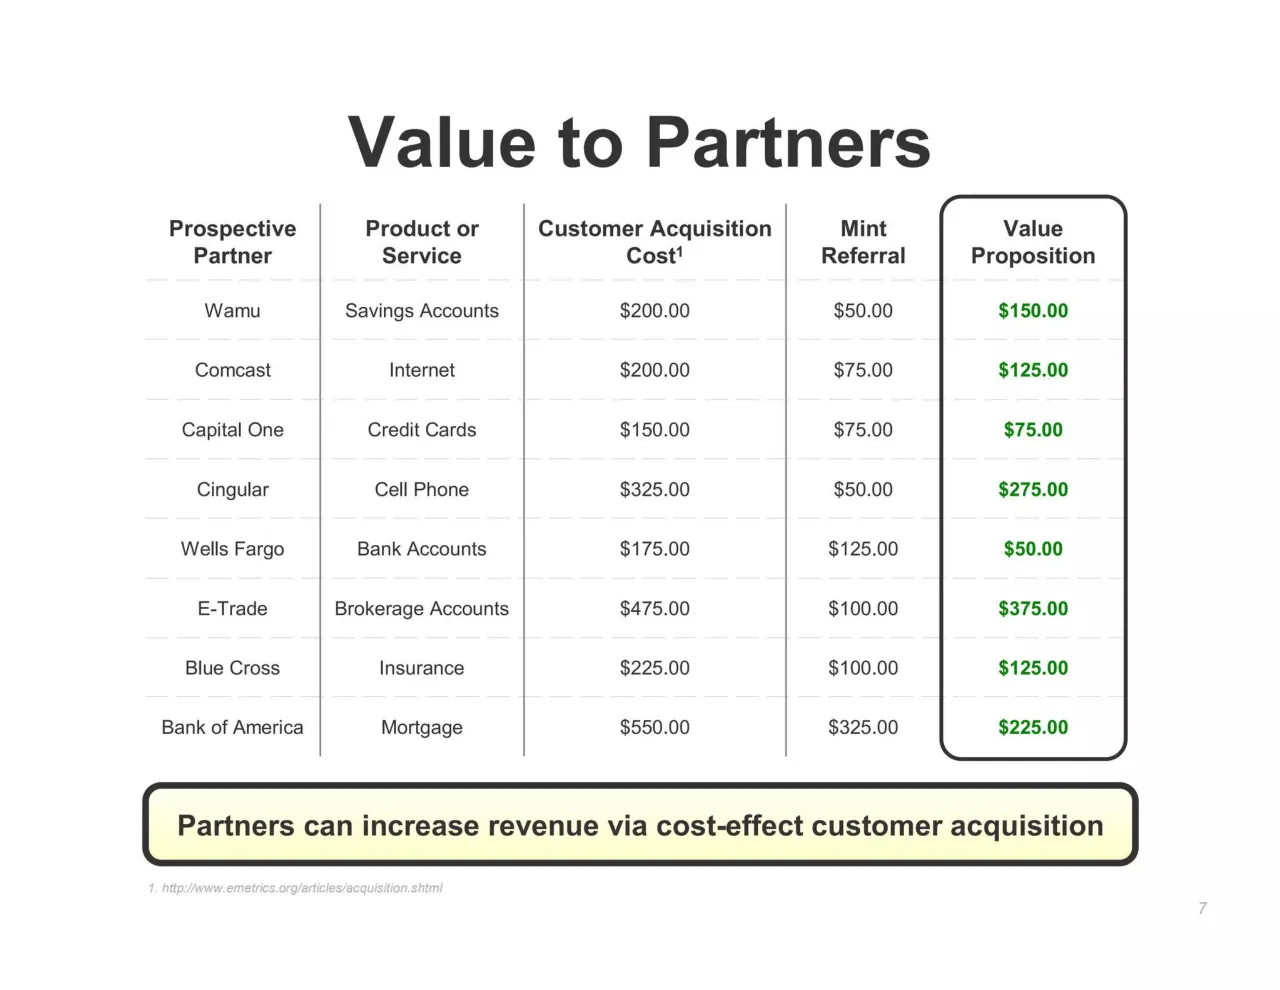
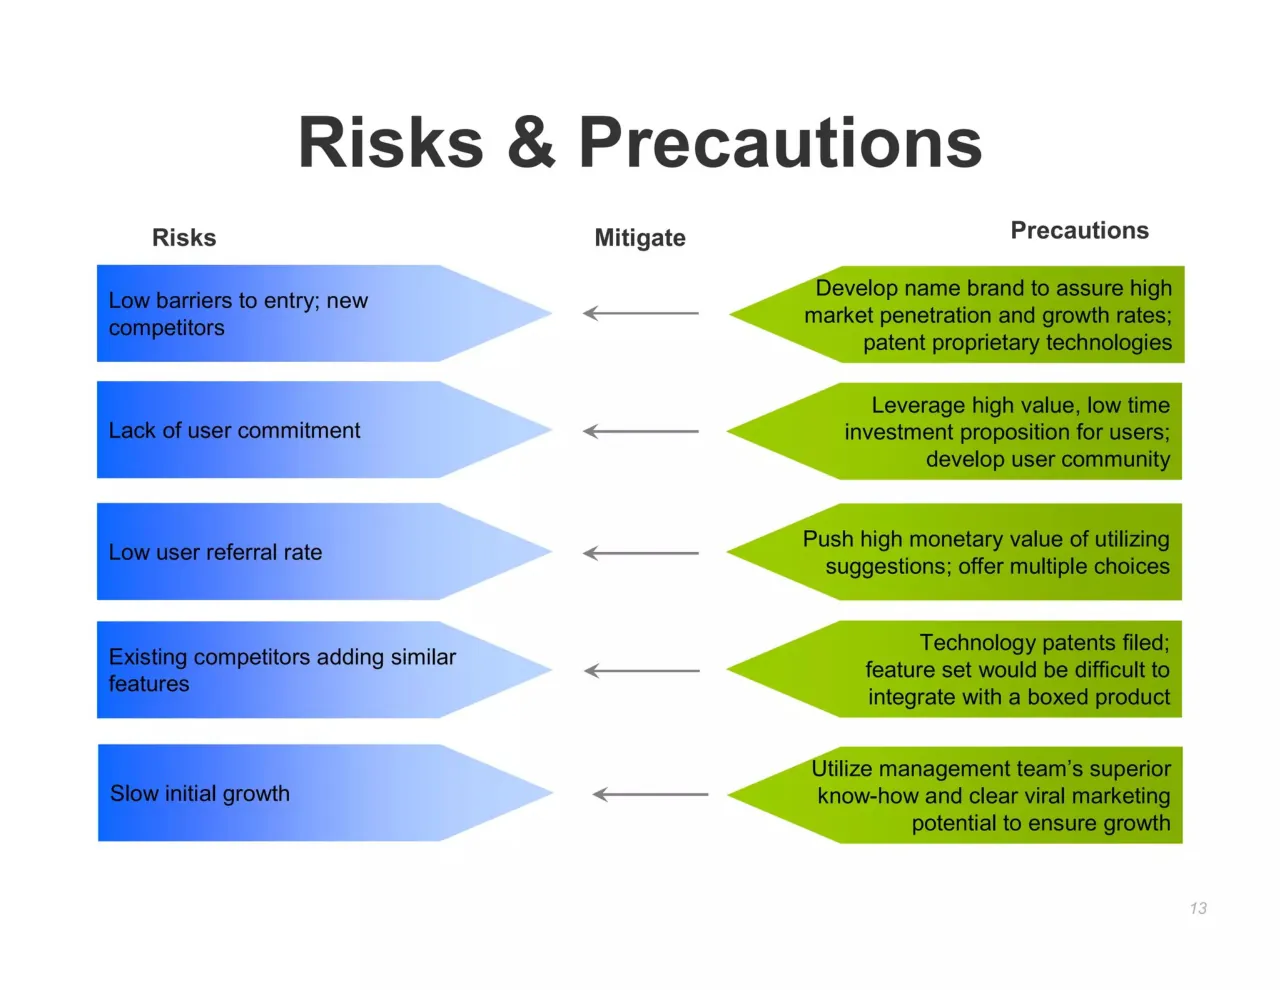
The deck opens with a title slide naming the four founders and a date in April 2007, followed by a product overview of the Mint personal finance application covering transactions, goals and net worth tracking. It then introduces the team and advisors, sizes the US market and its addressable opportunity, and compares Mint with its key competitor Wesabe and with potential entrants. Further sections cover value to users and to partner companies, user acquisition phases, the business model based on referral fees and future advertising, and a financials section with projected revenue, expenses and earnings. Later slides set out the exit strategy, risks and mitigations, competitive response and the financial assumptions behind the model, with a multiples analysis used to estimate exit value. The deck closes with a Q&A agenda and a risks table. Slides worth studying include the market size funnel on slide 4, the partner comparison table on slide 7, and the risks and mitigation grid on slide 13, which pair each risk with a concrete response in a single view.
Full text of the slides (16 slides)
Every slide's words and a description of its charts and images, so the deck can be searched and rebuilt. Also available as Markdown.
Slide 1
mint
TAKE BACK YOUR WALLET
Joanne Chen | Michael D'Orazio | Victor Ho | Alan Rutledge
April 20, 2007
Visuals: Logo: the mint brand mark, a green three-leaf mint sprig (leaves in mid-to-dark green #5A9E2F to #3E7D1E with visible vein texture) to the left of the lowercase wordmark 'mint' in medium green #6AAA3A, with the tagline 'TAKE BACK YOUR WALLET' in dark grey #4A4A4A bold geometric sans capitals below it, with a faint reflection beneath the wordmark and tagline. Decorative background: pale grey scrolling floral flourishes (light grey #E4E4E4 to #F0F0F0, low contrast) on the left and right sides of the logo band, fading toward the edges and bottom; they are not cropped and not boxed. No photographs.
Slide 2
Mint: Save Time & Money / mint TAKE BACK YOUR WALLET / + Add Account / Goals / Transactions / Analysis / Day Week Month Next 4 Days Agenda / May 2007 / Sun Mon Tue Wed Thu Fri Sat / Cingular Bill Due / Comcast Bill Due / Chase Credit Card Due / Accounts / Chase Platinum Visa Card $ - 1,204 / Bank of America Checking $ 4,356 / Cingular $ - 52 / Comcast $ - 87 / My Spending / Rent - $ 2200 / Food - $ 800 / Clothing - $ 280 / Vehicle - $ 400 / Entertainment - $ 200 / Other - $ 120 / Goals / Nissan 350Z / $5,000 saved / $20,000 needed / Trip to Vegas / $800 saved / $900 needed / Save Money / Save $500 per year by switching to WorldPoints Credit Card - 0%APR, no annual fees. / Switch to Verizon and save $10 per month - unlimited monthly minutes, $29.99 per month. / Transactions / List of detailed transactions grouped my category / All assets / All debt / Current net worth / Tags, to customize transactions into folders / Line graph plotting spending over time / Goals / List of goals / Current net worth allocated to goals / How much of goal is achieved / All assets / All debt / Current net worth / Notes / 2
Visuals: Screenshot of the Mint.com web dashboard (May 2007) in a light rounded-corner frame with thin grey border, not full-bleed, boxed. Top: mint logo (green leaf mark with green wordmark and tagline TAKE BACK YOUR WALLET), '+ Add Account' link in black bold, and three tabs: Goals (green), Transactions (green), Analysis (blue-violet). Main area: month calendar with light blue-grey week rows, day numbers in small grey type, and blue bill bars on 7 (Cingular Bill Due), 9 (Comcast Bill Due) and 15 (Chase Credit Card Due). Lower left: Accounts panel with green header and list of balances. Centre lower: My Spending pie chart in 3D with legend: Rent $2200 (lavender blue, largest slice about 55% of pie), Food $800 (maroon), Clothing $280 (pale yellow), Vehicle $400 (pale cyan), Entertainment $200 (dark purple), Other $120 (salmon). Lower left: Goals panel with purple header, Nissan 350Z $5,000 saved in green and $20,000 needed in red, Trip to Vegas $800 saved and $900 needed. Lower centre: Save Money panel with yellow header and blue hyperlinked text. Two annotations: thin black arrows, one from the Transactions callout to the Transactions tab, one from the Goals callout to the Goals tab.
Slide 3
Team & Advisors
Aaron Patzer
CEO & Founder
Lead Architect, Nascentric (chip simulation software)
Founder, GetAWebsite (search engine optimization)
David Michaels
VP Engineering
Director of Technology, ShockMarket Corporation
Director of Engineering, PGP (security software)
Dave McClure
Director Marketing
Director of Marketing, PayPal (micro-payments)
Director of Marketing, Simply Hired (job search)
Jason Putorti
Lead Designer
CTO & Founder, Novaroura (acquired by FittingGroup)
Co-Founder, Six Madison (anti-fraud SAS)
Investors & Advisors
First Round Capital, Felicis Ventures, Ron Conway, Scott Cook (Intuit Founder & CEO)
3
Visuals: Four small right-pointing block arrows, one per team row, outlined in dark grey #333333 with a light green fill (#E6FF99 to #CCFF66) and placed between each person box and its description. They are not connected to each other. No photographs, charts, logos or icons.
Slide 4
Market Size - US
49 Million People
22 to 35 age range
31 Million Prospective Mint Users
64% of target demographic use online banking
Referrals (CPA)
$8 RPU per year w/ 14% CAGR
Advertising (CPC)
$4.50 RPU per year w/ 22% CAGR
Conversion
CPA
Referral
Data to Leverage
0.75%
$50.00
Savings Accounts
Zip Code (feasibly: School or Workplace)
1.00%
$75.00
Internet
Age (feasibly: Gender)
0.50%
$75.00
Credit Cards
Income (propensity to spend)
0.25%
$50.00
Cell Phone
Where and when you shop
0.10%
$200.00
Bank Accounts
What brands you buy
$388 Million Total Addressable Market Opportunity w/ 16% CAGR
4
Visuals: Block arrow: a right-pointing outlined block arrow centred between the two top boxes, filled with a horizontal green-to-white gradient (#C8F76B to #FFFFFF), dark grey outline #333333 about 2 px wide. Table 1 (left, under Referrals box): 3 columns Conversion, CPA, Referral, with 5 data rows: 0.75% / $50.00 / Savings Accounts; 1.00% / $75.00 / Internet; 0.50% / $75.00 / Credit Cards; 0.25% / $50.00 / Cell Phone; 0.10% / $200.00 / Bank Accounts. Table 2 (right, under Advertising box): 1 column Data to Leverage with 5 rows: Zip Code (feasibly: School or Workplace); Age (feasibly: Gender); Income (propensity to spend); Where and when you shop; What brands you buy. Table 1 has light grey dashed vertical dividers between columns, and grey solid horizontal rules under the header and each row. Table 2 has grey solid horizontal rules only. No photographs, logos or charts.
Slide 5
Competitors / Key Competitor: Wesabe / Potential Entrants / wesabe / • No revenue model – Freemium / • Community based - limited source of information from “wisdom of the crowds” / • Poor traction / • Unspecific suggestions / Microsoft Money / Quicken / • Develop simple, easy-to-use, free personal finance online application to cater to mainstream / • Acquire Wesabe or similar online application / Mint’s Comp. Advantages / • User-specific saving opportunities / • Compelling AI-based auto-sorting / • Easy and intuitive user interface / Mint’s Defensibility / • High service switching costs / • 3 non-pending technology patents / • Integration partnerships (TurboTax) / 5
Visuals: Four rounded-rectangle callout boxes, two logo groups and a dashed divider line. Wesabe logo: a square green-and-black 'W' icon with the word 'wesabe' beneath it in a serif-like black wordmark, followed by a small outlined right-pointing block arrow filled with pale green (#E4F9B0) and dark grey outline, pointing from the logo toward the left green box. Microsoft Money logo: 'Microsoft' in small black text above a bold black 'Money' wordmark, on white. Quicken logo: white bold italic 'Quicken' lettering on a solid red (#E0474C) rectangle. Divider: thin light grey (#BFBFBF) dashed line spanning the full grid width between the two rows. No charts, photographs or tables.
Slide 6
Value to User
Mint
TAKE BACK YOUR WALLET
Ease of / Use
Finance / Software
Online / Banking
Finance Social / Networks
Easily tracks and logs / data from multiple sites
Steep learning / curve; UI cluttered / with excessive / features
Inconsistent layout; / difficult to aggregate / other sites
Intuitive interfaces; / simplified features
Costs
Free to use; / Automated billing / and categorization
Required initial / investment and / update fees
Integrated with bank / account and bill pay
Users must contribute / to add value
Benefits
Saves time / Save money
Powerful feature / set for keeping / finances organized
International presence; / strong advertiser / network, existing users
Low quality user- / generated advice
Mint offers the most compelling and easy way to manage your personal finances.
6
Visuals: Non-text elements: a Mint logo at the top of the highlighted first column showing a green mint-leaf sprig (three leaves) beside the lowercase word 'mint' in green, with the small black tagline 'TAKE BACK YOUR WALLET' beneath it; a thick dark grey (#333333) rounded rectangle outlining the Mint column from the header row down to the Benefits row; two thin light grey (#BBBBBB) horizontal rules separating the three rows, spanning the grid width; two thin grey dashed vertical lines separating the Mint, Finance Software, Online Banking and Finance Social Networks columns; a thick dark grey rounded-corner callout box with a pale yellow fill (#FFFBD0) at the bottom of the slide; rotated row labels 'Ease of Use', 'Costs' and 'Benefits' in bold dark text. No photographs, charts or icons other than the Mint logo.
Slide 7
Value to Partners
Prospective Partner
Product or Service
Customer Acquisition Cost1
Mint Referral
Value Proposition
Wamu
Savings Accounts
$200.00
$50.00
$150.00
Comcast
Internet
$200.00
$75.00
$125.00
Capital One
Credit Cards
$150.00
$75.00
$75.00
Cingular
Cell Phone
$325.00
$50.00
$275.00
Wells Fargo
Bank Accounts
$175.00
$125.00
$50.00
E-Trade
Brokerage Accounts
$475.00
$100.00
$375.00
Blue Cross
Insurance
$225.00
$100.00
$125.00
Bank of America
Mortgage
$550.00
$325.00
$225.00
Partners can increase revenue via cost-effect customer acquisition
1. http://www.emetrics.org/articles/acquisition.shtml
7
Visuals: A table with five columns and nine rows including the header. Columns: Prospective Partner; Product or Service; Customer Acquisition Cost (footnote 1); Mint Referral; Value Proposition. Rows: Wamu | Savings Accounts | $200.00 | $50.00 | $150.00. Comcast | Internet | $200.00 | $75.00 | $125.00. Capital One | Credit Cards | $150.00 | $75.00 | $75.00. Cingular | Cell Phone | $325.00 | $50.00 | $275.00. Wells Fargo | Bank Accounts | $175.00 | $125.00 | $50.00. E-Trade | Brokerage Accounts | $475.00 | $100.00 | $375.00. Blue Cross | Insurance | $225.00 | $100.00 | $125.00. Bank of America | Mortgage | $550.00 | $325.00 | $225.00. The Value Proposition values are set in bold green (about #008000). Solid dark grey vertical rules (about #333333, 1 px) separate the columns after Prospective Partner, Product or Service, and Customer Acquisition Cost, and the rule after Mint Referral is absent, while the Value Proposition column is enclosed by a thick dark grey (#333333) rounded rectangle outline about 3 px wide with corner radius about 2% of slide width. Light grey dashed horizontal row separators (about #CCCCCC) run between rows. No chart, photograph or logo is present.
Slide 8
User Acquisition
Launch
Growth
Maturity
Word of mouth & viral, Blogosphere referral badges, sharable website tags
Direct email
• Targeted opt-in email lists
• College list serves
• Symposium & events
• Personal finance lists
Distribution partners
• Affiliate networks
• Mutual linking sites
Internet advertising
• Overture + Adwords
PR
• Buzz marketing
• Company blog
• PR tactics
SEO
• Organic search
• Optimized page markup
8
Visuals: Three green-gradient rounded header boxes labelled Launch, Growth and Maturity across the top; one wide light-blue gradient band below them reading Word of mouth & viral, Blogosphere referral badges, sharable website tags; six rounded light-blue gradient boxes arranged in columns: Direct email (left, tall), SEO (left, lower), Distribution partners (middle, upper), PR (middle, lower), Internet advertising (right, upper); one cartoon illustration of a green round creature with a yellow flower-petal hat, open smiling mouth with red tongue and orange eyes, sitting in the lower-right cell, full colour, no background, not boxed.
Slide 9
Business Model
User Acquisition
Gather User Information
Intelligent Suggestions
User Switches = Referral Fee
From
• Advertising
• E-mail
• Viral Marketing
• Distribution Partners
Includes
• Account Types
• Spending Patterns
• Credit History
• Demographics and Preferences
Based On
• History
• Usage
• Spending Habits
• Current Market Deals/Rates
Fee Types
• Bank Account
• Credit Card
• Cell Phone Carrier
• ISP
• Loan
Mint makes money when users make money rather than relying on creating value through added services
Future Potential: Advertising
Large expected user base
+
High quality user data
+
Premium targeted ads
=
High Profit Potential
9
Visuals: Process diagram. Row 1: four rounded green rectangles, labelled User Acquisition, Gather User Information, Intelligent Suggestions and User Switches = Referral Fee, connected left to right by three small outlined right-pointing block arrows with white fill and dark grey outline. Row 2: four rounded white-to-pale-blue rectangles listing From, Includes, Based On and Fee Types, each placed directly under the matching green box. Row 3: a full-width green rounded banner stating the business model. A light grey dashed horizontal line sits below the banner. Row 4: four grey rounded rectangles chained by the operators +, +, and = (plus, plus, equals in dark grey bold), ending in High Profit Potential. No charts, photographs or logos.
Slide 10
Financials / Projected Year Ending December 31, / 2007 / 2008 / 2009 / 2010 / Total Users 100.0 180.0 309.6 510.2 / Referrals / Credit Cards $56.3 $111.4 $210.7 $382.0 / Savings Accounts 50.0 101.3 195.9 363.2 / Bank Accounts 30.0 62.1 122.8 232.8 / Internet Service Provider 97.5 193.1 365.3 662.1 / Cell Phone 17.5 33.3 60.4 104.6 / Targeted Advertising 500.0 1,012.5 1,959.2 3,632.3 / Total Revenue $751.3 $1,513.6 $2,914.3 $5,377.1 / Sales and Marketing Expense 225.4 302.7 291.4 268.9 / General and Administrative Expense 300.0 544.0 942.7 1,565.3 / Research and Development Expense 187.8 340.6 590.1 980.0 / EBIT $38.1 $326.3 $1,090.1 $2,562.9 / Assumptions / Investment $3.0M / Stake 15% / Hurdle Rate 5% / IRR: 25% / Expected Earnings / Revenue by Source / Downside / Expected / Upside / Targeted Advertising / Savings Accounts / Credit Cards / Bank Accounts / Cell Phone / 10
Visuals: Two charts and one table. Chart 1: line chart titled Expected Earnings. Y axis titled Dollars (Millions), ticks from ($1.0) to $5.0 in steps of $1.0 with $0.0 baseline; X axis years 2007, 2008, 2009, 2010. Three series with about values read from the plot: Downside about 0.45 (2007), 1.2 (2008), 2.6 (2009), 4.7 (2010), drawn as a navy-blue #2E2E8C line; Expected about 0.02, 0.1, 0.45, 1.1 as a magenta #FF33FF line; Upside about 0.05, 0.4, 1.4, 3.5 as a yellow #FFFF33 line. Legend below the plot in order Downside, Expected, Upside with short line swatches. No highlighted points. Chart 2: stacked column chart titled Revenue by Source. Y axis titled Dollars (Millions), ticks 0.0 to 5.0 in steps of 0.5; X axis 2007, 2008, 2009, 2010. Stacks from bottom: Targeted Advertising dark purple #660066, Savings Accounts maroon #993366, Credit Cards lavender #9999FF, Bank Accounts pale yellow #FFFFCC, Cell Phone pale green #CCFFFF. Approximate totals: 2007 about 0.67, 2008 about 1.33, 2009 about 2.55, 2010 about 4.72; Targeted Advertising about 0.5, 1.0, 1.95, 3.63. Legend in one row below the axis with square swatches. Table: columns are the row label, then 2007, 2008, 2009, 2010 under the heading Projected Year Ending December 31, with values as printed; 2007 header and the 300.0 cell in blue, EBIT row bold, rules above Total Revenue and above EBIT. Assumptions box: Investment $3.0M, Stake 15%, Hurdle Rate 5%. IRR box: rounded rectangle reading IRR: 25%.
Slide 11
Exit Strategy
mint
TAKE BACK YOUR WALLET
Google
YAHOO!
Intuit
Microsoft
Allows Google
entrance into personal
finance industry by
providing simple, free
application
Low switching
costs for current
product set; desire
to increase lock-in
Expand personal
finance presence by
bringing personal
finance software to
mainstream
Expand personal
finance presence by
bringing personal
finance software to
mainstream
More targeted
advertising; increased
customer lock-in
More targeted
advertising; increased
customer lock-in
Increase product
upsell; augment
patented technology
Integration with MS
Money by providing
online interface
Seamless integration
with Google Finance
site
Seamless integration
with Yahoo Finance
site
Integration with
Quicken by providing
online interface
Increase product
upsell; augment
patented technology
11
Visuals: Mint logo (centred, under the title): a green three-leaf mint sprig icon beside the lowercase green wordmark 'mint' with the tagline 'TAKE BACK YOUR WALLET' in small dark capitals beneath; faint reflection beneath the wordmark. Four company logos in a row: Google (multicolour wordmark, blue-red-yellow-blue-green-red letters), Yahoo! (red wordmark with exclamation mark), Intuit (black bold wordmark with a small swoosh mark), Microsoft (black italic bold wordmark with registered mark). A full-width light grey dashed horizontal rule separates header from grid. Three faint grey dashed vertical dividers run between the columns. No charts, photographs or diagrams.
Slide 12
Q & A
Product
Team
Market Size
Value to Users
Business Model
User Acquisition
Financials
Acquirers
Risks & Precautions
Product Comparisons
Alternative Revenue Streams
Management Expertise
Potential Acquirers
5-Year Revenue Projections
12
Slide 13
Risks & Precautions
Risks
Mitigate
Precautions
Low barriers to entry; new competitors
Develop name brand to assure high market penetration and growth rates; patent proprietary technologies
Lack of user commitment
Leverage high value, low time investment proposition for users; develop user community
Low user referral rate
Push high monetary value of utilizing suggestions; offer multiple choices
Existing competitors adding similar features
Technology patents filed; feature set would be difficult to integrate with a boxed product
Slow initial growth
Utilize management team’s superior know-how and clear viral marketing potential to ensure growth
13
Visuals: Five blue gradient homePlate-style arrow shapes pointing right, each with a flat left edge and a pointed right tip, stacked vertically in the left column; each contains one risk label. Five small grey (#808080) straight arrows with arrowheads pointing left, one per row, in the centre column, drawn as thin lines about 0.8% of slide height thick. Five green gradient shapes pointing left, each with a flat right edge and a pointed left tip, stacked in the right column, each containing one precaution text. No photographs, icons or logos; no charts or tables.
Slide 14
Competitive Response / Microsoft / Result / MyMint / Attempts to copy MyMint’s / website and business model / Delays Microsoft / market entry and / increases costs / Enforce patent protection of / proprietary technology / Leverages brand name and / market reach / User base safe, / competition for new / users may occur / Satisfied users have little / incentive to switch / Extensive experience and / software specialization / No advantage / Highly experienced / management team / Synergies with current / software such as Quicken / MyMint offers a / unique product / Technology extends beyond / reach of existing software / Defensibility / 14
Visuals: Diagram with three columns and an ellipse. Header boxes: 'Microsoft' (left) and 'MyMint' (right), both grey gradient rounded rectangles. Centre column header is the text 'Result' in bold underlined type with no box. Left column: four right-pointing pentagon arrows, green gradient, labelled 'Attempts to copy MyMint’s website and business model', 'Leverages brand name and market reach', 'Extensive experience and software specialization', 'Synergies with current software such as Quicken'. Centre column: four downward blue gradient chevron shapes stacked vertically, labelled 'Delays Microsoft market entry and increases costs', 'User base safe, competition for new users may occur', 'No advantage', 'MyMint offers a unique product'. Right column: four left-pointing pentagon arrows, green gradient, labelled 'Enforce patent protection of proprietary technology', 'Satisfied users have little incentive to switch', 'Highly experienced management team', 'Technology extends beyond reach of existing software'. Arrows in each row point toward the centre column, which is a flow from both sides into the Result chevrons. A wide grey gradient ellipse labelled 'Defensibility' lies below the centre column. No photographs, logos or icons. Dark outlines around all shapes.
Slide 15
Financial Assumptions / User Base / Adoption Rate / 80.0% 72.0% 64.8% Step / 1 80.0% 68.0% 57.8% (15.0%) / 2 80.0% 72.0% 64.8% (10.0%) / 3 100.0% 90.0% 81.0% (10.0%) / Referrals / Credit Cards / 0.75% 0.83% 0.91% 1.00% Step / 1 0.50% 0.55% 0.61% 0.67% 10.0% / 2 0.75% 0.83% 0.91% 1.00% 10.0% / 3 1.00% 1.10% 1.21% 1.33% 10.0% / Savings Accounts / 1.00% 1.13% 1.27% 1.42% Step / 1 0.75% 0.83% 0.91% 1.00% 10.0% / 2 1.00% 1.13% 1.27% 1.42% 12.5% / 3 1.25% 1.44% 1.65% 1.90% 15.0% / Bank Accounts / 0.15% 0.17% 0.20% 0.23% Step / 1 0.10% 0.12% 0.13% 0.15% 15.0% / 2 0.15% 0.17% 0.20% 0.23% 15.0% / 3 0.20% 0.23% 0.26% 0.30% 15.0% / Internet Service Provider / 1.3% 1.4% 1.6% 1.7% Step / 1 1.0% 1.1% 1.2% 1.3% 10.0% / 2 1.3% 1.4% 1.6% 1.7% 10.0% / 3 1.6% 1.8% 1.9% 2.1% 10.0% / Cell Phone / 0.35% 0.37% 0.39% 0.41% Step / 1 0.25% 0.25% 0.25% 0.25% (15.0%) / 2 0.35% 0.37% 0.39% 0.41% (10.0%) / 3 0.45% 0.45% 0.45% 0.45% (10.0%) / Advertising / Targeted Advertising / $5.0 $5.6 $6.3 $7.1 Step / 1 $5.0 $5.5 $6.1 $6.7 10.0% / 2 $5.0 $5.6 $6.3 $7.1 12.5% / 3 $5.0 $5.8 $6.6 $7.6 15.0% / Costs / Sales and Marketing Expense 30.0% 20.0% 10.0% 5.0% / General and Administrative Expense 39.9% 35.9% 32.3% 29.1% (10.0%) / Research and Development Expense 25.0% 22.5% 20.3% 18.2% Step / 1 25.0% 23.8% 22.6% 21.4% (5.0%) / 2 25.0% 22.5% 20.3% 18.2% (10.0%) / 3 25.0% 21.3% 18.1% 15.4% (15.0%) / 15
Visuals: A table of financial assumptions with no borders or fills, only one grey rectangle. Columns, left to right: section and row labels (underlined section headings such as User Base, Referrals, Advertising, Costs; indented item labels), a small blue index column (1, 2, 3), four value columns, and a Step column. Header rows per item show orange-brown values (for example 80.0% 72.0% 64.8% Step for Adoption Rate). Rows 1, 2 and 3 show blue or black values, with Step values in blue in parentheses or as percentages. The Adoption Rate row 1 value cell is covered by a plain light-grey rectangle with no text. Costs items: Sales and Marketing Expense shows blue values 30.0% 20.0% 10.0% 5.0%; General and Administrative Expense shows black values 39.9% 35.9% 32.3% 29.1% with Step (10.0%); Research and Development Expense is laid out as the other items. No charts, photographs, logos or icons.
Slide 16
Exit Calculation
Multiples Analysis for MyMint
Dollars in Millions (MyMint in Thousands)
Company / Ticker / Enterprise Value / 2007 Sales / 2007 EBIT / EV/Sales / EV/EBIT
PlanetOut.inc / LGBT / $61.9 / $76.0 / ($7.2) / .8x / N/A
DealerTrack / TRAK / $940.2 / $219.8 / $57.3 / 4.3x / 16.4x
Synchronoss Technologies / SNCR / $490.8 / $101.8 / $24.0 / 4.8x / 20.5x
1 High / 4.8x / 20.5x
2 Average / 3.3x / 9.4x
3 Median / 4.3x / 16.4x
4 Low / .8x / N/A
MyMint / 2007 / 2008 / 2009 / 2010 / 2011 / 2012 / EV
Sales / 751.3 / 1,513.6 / 2,914.3 / 5,377.1 / 9,532.4 / 16,278.8 / Sales Year / 3 / $25,914
EBIT / 38.1 / 326.3 / 1,090.1 / 2,562.9 / 4,994.7 / 9,223.1 / Method / 1 / $52,414
Cash Flows / (3,000) / $49 / $164 / $6,259 / Assumptions / Average EV
Investment / $3.0M
Stake / 15%
Hurdle Rate / 5%
Reinvested IRR / 25% / $39,164
16
Visuals: Two spreadsheet-style tables, no chart, photograph or logos. Table 1 (comparables), columns: Company, Ticker, Enterprise Value, 2007 Sales, 2007 EBIT, EV/Sales, EV/EBIT. Rows: PlanetOut.inc, LGBT, $61.9, $76.0, ($7.2), .8x, N/A; DealerTrack, TRAK, $940.2, $219.8, $57.3, 4.3x, 16.4x; Synchronoss Technologies, SNCR, $490.8, $101.8, $24.0, 4.8x, 20.5x. Below it a boxed summary with a thin black outline, labels numbered 1 to 4: High 4.8x / 20.5x; Average 3.3x / 9.4x; Median 4.3x / 16.4x; Low .8x / N/A. Table 2 (projection), columns 2007 to 2012 underlined year headers. Row Sales: 751.3, 1,513.6, 2,914.3, 5,377.1, 9,532.4, 16,278.8. Row EBIT: 38.1, 326.3, 1,090.1, 2,562.9, 4,994.7, 9,223.1. Row Cash Flows (bold): (3,000), $49, $164, $6,259, blank for 2011 and 2012. Input cells: Sales Year value 3 and Method value 1, both in yellow boxes with thin black outlines, fill about #FFFF99; the EV column shows $25,914 (Sales Year case) and $52,414 (Method case) in thin-outlined white boxes. A grey panel (fill about #C0C0C0, black outline) holds Assumptions with Investment $3.0M, Stake 15%, Hurdle Rate 5%. An outlined white box holds the reinvested IRR value 25%, and another outlined box holds Average EV $39,164. Lines: one heavy black rule under the subtitle, one thin black rule across the table about 47 percent down.