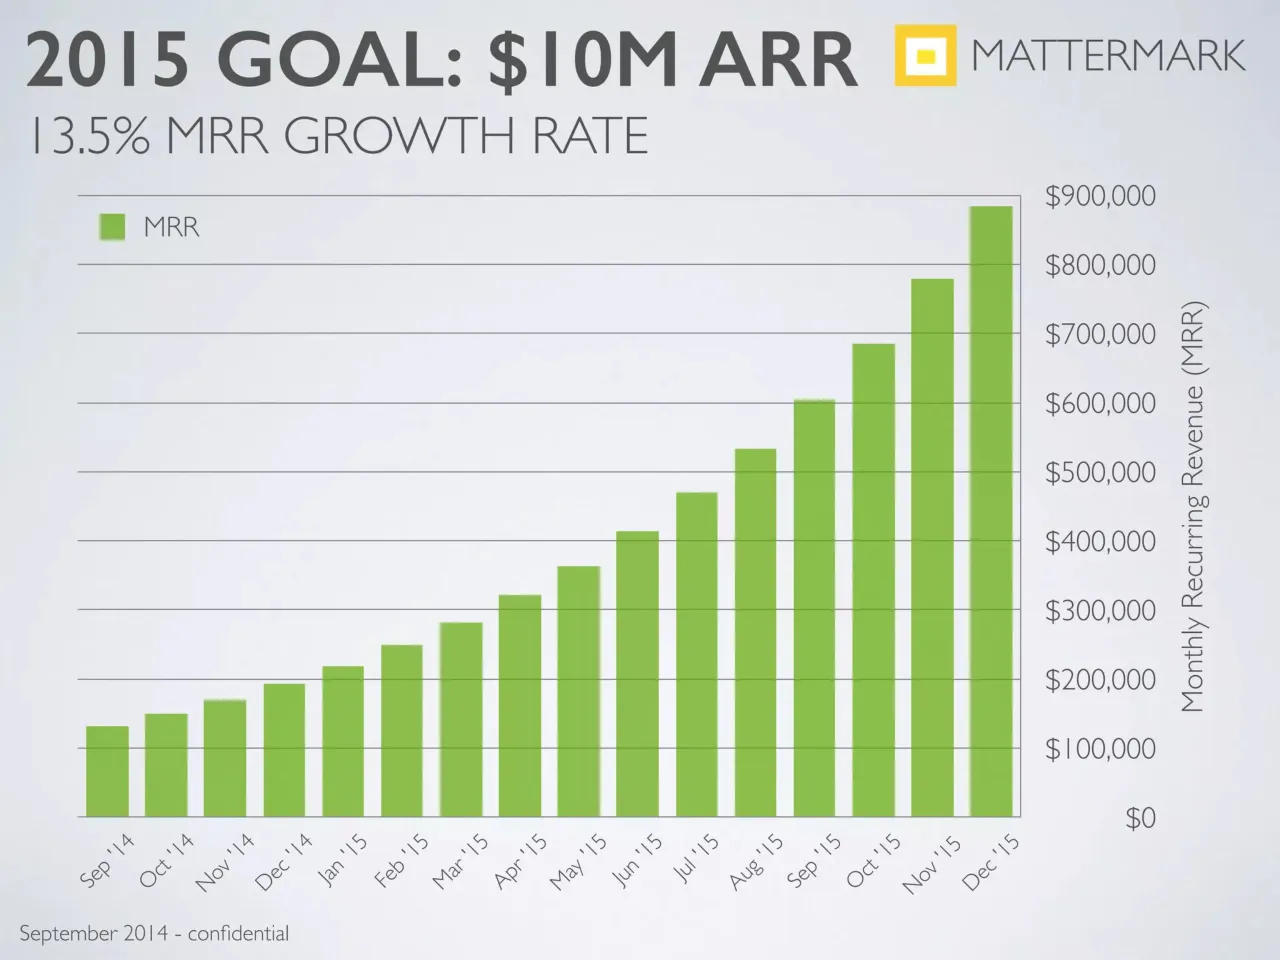
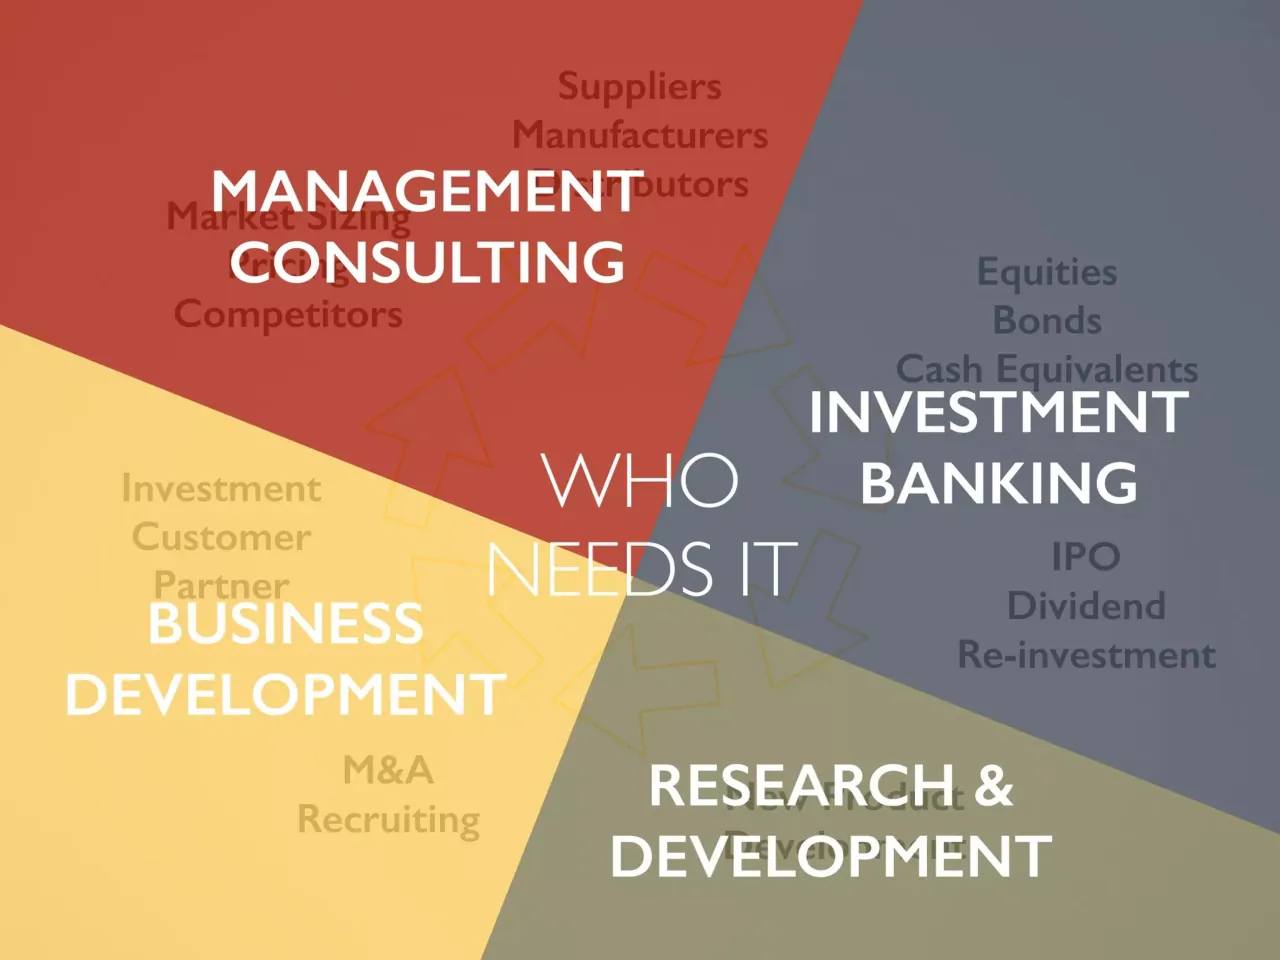
The deck opens with a title and a one-line mission to organize the world's business information, then frames the problem: professionals lack a reliable way to ask business questions and get data-backed answers. It moves through market context and a proposed B2B search product, then sizes the audience from venture capitalists and angel investors to sales and business development professionals and later consultants and bankers. Traction follows, with monthly recurring revenue growth charts, a 2015 revenue goal, and revenue broken down by use case. Later sections cover the core questions customers ask, the data needed to answer them, the number of companies tracked, and a pace target for coverage. The deck closes with the leadership team, with short bios for each founder and key hires, and a final title card. Several slides are worth studying for how they present growth as simple line charts with one headline number and how a single diagram maps data needs to user groups.
Slides worth studying
Questions about this deck
How many slides does the Mattermark pitch deck have and how is it structured?
The Mattermark deck has 30 slides. It opens with a title and mission on slide 1, moves through the problem and audience on slides 4 to 10, covers traction on slides 11 to 14, and closes with the leadership team on slides 23 to 29 and a final title card on slide 30.
What does the Mattermark deck say about its target market and audience size?
Slide 9 lists the audience in phases, starting with venture capitalists, angel investors and founders in the first 6 months. Slide 10 gives 30,000 VC & Private Equity Professionals and 568,000 Sales Managers & Professionals, with a $3 Billion revenue opp. in existing verticals.
What revenue figures and goals does the Mattermark deck show?
Slide 11 shows $125K MRR and a 377% CAGR. Slide 12 sets a 2015 GOAL of $10M ARR with a 13.5% MRR GROWTH RATE.
How many companies does Mattermark track according to its deck?
Slide 20 states 500K+ companies are currently tracked by Mattermark. Slide 22 sets a pace target of 3M companies by September 2015.
Details
- Company: Mattermark
- Year: 2014
- Type: Pitch deck
- Industry: B2B data and market intelligence
- Pages: 30
Review score: 6 out of 10, Needs substantial work
Presentation quality, judged with the SlideDeck Co review heuristic. Ask, evidence and idea merit are not rated here.
The deck has a clear spine (mission, problem shown through Google searches, audience, traction, data coverage, team) and strong chart pages: slides 12, 22 and 23 each carry one headline claim over a simple bar chart, and slide 1 and the identity are clean and consistent. But the key diagram on slide 18 is damaged: the colored wedges sit over the earlier slide's labels, so white headings collide with faded text ('Market Sizing', 'Pricing', 'New Product Development' are partly unreadable), and the pale yellow wedge gives weak contrast with white text. Slides 11, 13 and 14 are dense, with dual-axis or many-series charts that are hard to read, and several pages (15, 21, 23, 27) are near-empty dividers or placeholders with gray 'Avi' and 'TBH' boxes, so the deck needs substantial cleanup before it fully works.
Worth keeping: Keep the single-claim chart titles on slides 12, 22 and 23, the Google search screenshots that dramatize the problem on slides 5 to 7, and the consistent yellow square identity.
Most useful repair: Rebuild slide 18 so that each user group and its data needs sit in separate readable zones with sufficient contrast, and replace the placeholder name boxes and sparse team slides (27 to 29) with real content or remove them.
What would change the score: Simplify slides 11, 13 and 14 to one series or one message each, and cut the divider slides (15, 21, 23) or give them a point.
Confidence high. 30 of 30 pages inspected on contact sheets, 4 at readable size. Reviewed 2026-11-08. Model-assisted review (claude-sonnet-5-5).
Full text of the slides (30 slides)
Every slide's words and a description of its charts and images, so the deck can be searched and rebuilt. Also available as Markdown.
Slide 1
MATTERMARK
organizing the world's business information
September 2014 - confidential
Visuals: Logo mark: a square icon centered horizontally, spanning roughly x 41% to 59%, y 18% to 48%. It consists of an outer square in yellow #F8CB2F, an inner white square #FFFFFF, and a small yellow rectangle #FDE233 at its center. The rectangle is horizontal, about 10% of slide width by 7% of slide height. No photographs, charts or other graphics.
Slide 2
Organizing the world’s business information to answer questions about the companies you want to do business with
MATTERMARK
September 2014 - confidential
Slide 3
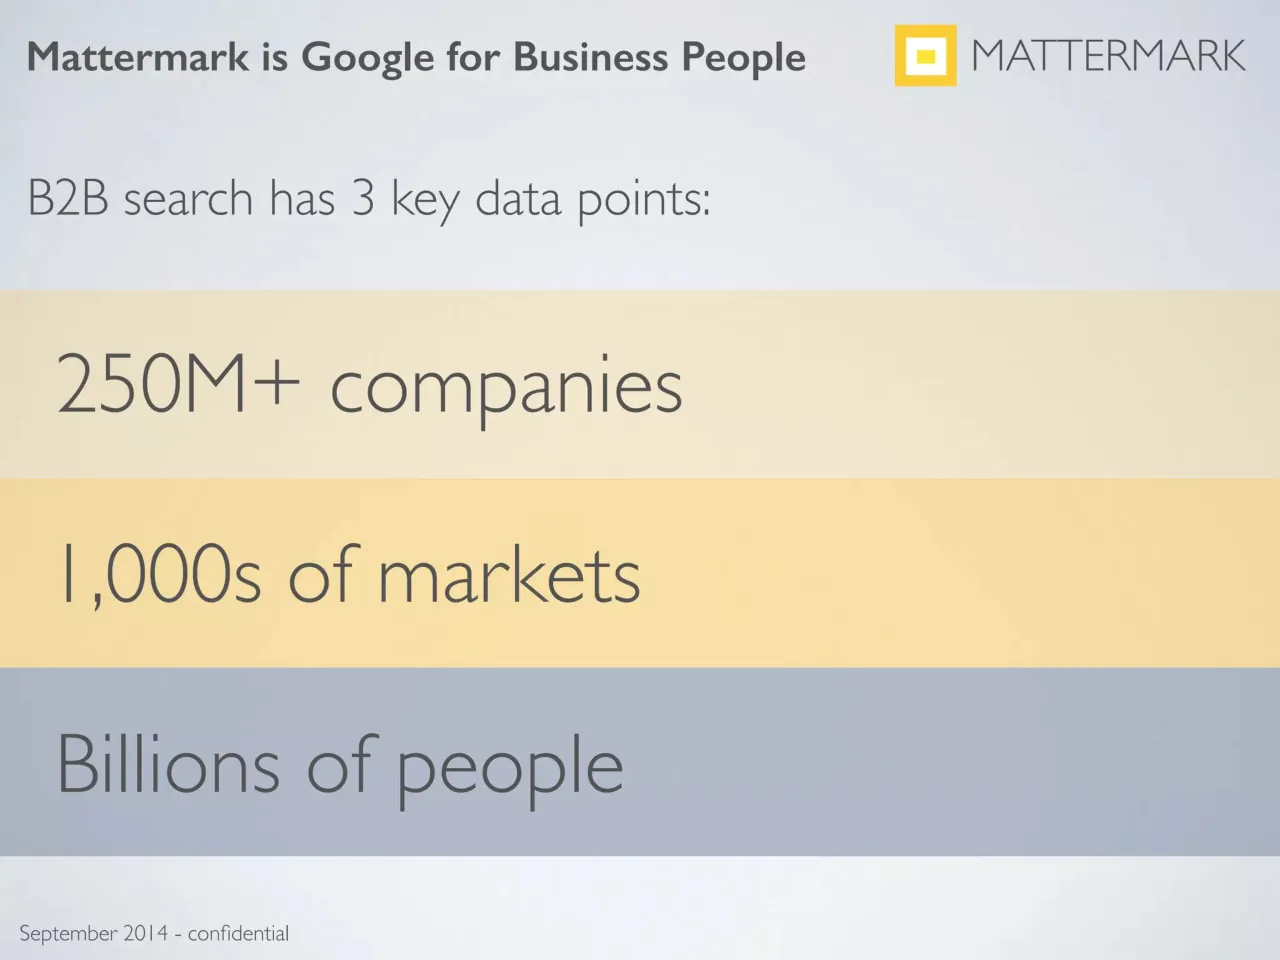
Mattermark is Google for Business People
MATTERMARK
B2B search has 3 key data points:
250M+ companies
1,000s of markets
Billions of people
September 2014 - confidential
Slide 4
MATTERMARK
The problem:
There is no effective, reliable way for
professionals to ask business questions and
get credible intelligence supported by data.
when you buy a CRM it comes empty
everyone is re-collecting the same information
everyone is re-creating the same spreadsheets
99% of knowledge workers can’t afford consultants
PDFs, reports, etc. are not structured or searchable
September 2014 - confidential
Visuals: One non-text visual: a square logo mark at top right, made of a yellow outer square with a white square ring inside and a small yellow square at its centre, followed by the MATTERMARK wordmark in uppercase light sans-serif dark grey. No photographs, charts, tables or diagrams.
Slide 5
what is the market size of saas
Web
News
Images
Videos
Shopping
More
Search tools
About 184,000 results (0.58 seconds)
SaaS Cloud Solutions - CDW.com
Ad
www.cdw.com/Cloud
End-to-End Consultation on Software as a Service Deployment at CDW.
Application Management
Contact a Specialist
Secure Your Cloud
Risk Mitigation Methods
Gartner CRM Market Share Update: 41% Of CRM Systems ...
www.forbes.com/.../gartners-crm-market-share-update-shows-41-...
Forbes
May 6, 2014 - Gartner's latest CRM market share reports that the worldwide CRM / market ... in 2013, with 41% of all systems sold in 2013 being SaaS-based.
State of SaaS 2014 and its Challenges - Compass
blog.startupcompass.co/2014-saas-market-outlook
Mar 11, 2014 - Gartner forecasts the SaaS market will grow at 20% through at least ... / also measures a push for profitability over growth, often limiting size.
SaaS predictions for 2014 | PCWorld
Visuals: A screenshot of a Google search results page in a browser window, shown as a flat UI capture with no photographs or charts. Shapes: a white browser window with a light grey gradient surround; a grey header band (#F2F2F2) holding the multicolour Google wordmark (blue, red, yellow, blue, green, red) and a white search box with a thin grey border (#C0C0C0) containing the query text. The Web tab is red (#DD4B39) with a red underline bar about 0.5% of slide height thick; other tabs are grey (#5F6368). A yellow (#FBBC04) rounded square badge reading Ad sits before the first result's URL. An info icon (circled i, grey outline) sits at the right of the first result. Four blue sitelinks are arranged in a two-by-two grid under the first ad. A thin light grey horizontal rule separates the ad from the organic results.
Slide 6
Google / all series a rounds in 2013 / Web / News / Shopping / Images / Videos / More / Search tools / About 65,600,000 results (0.45 seconds) / The Series A Round Is The New Series B Round | TechCru... / techcrunch.com/2013/.../the-series-a-round-is-the-new-series... TechCrunch / Jun 18, 2013 - The Series A Round Is The New Series B Round ... In my short two- / year tenure as a full-time investor, I've seen this .... Posted Jun 18, 2013 ... / Bridge Rounds vs Series A Rounds - Tech Cocktail / tech.co/bridge-rounds-vs-series-rounds-2013-09 Tech Cocktail / Sep 16, 2013 - Sep 16, 2013 - Danny Boice for the National Edition ... of funding that / comes between your seed round and your full-blown Series A round. / The 10 Largest Super-Sized Series A Rounds Hauled in ... / www.cbinsights.com/blog/series-a-venture-capitalmega-deals-2013/ / Mar 11, 2014 - Super-sized Series A transactions jumped over 200% since 2009. In / 2013, already acquired AirWatch led the list of super-sized Series As ... / Behind the Series B Crunch: Profligate Entrepreneurs or ... / www.inc.com/.../the-series-b-crunch-and-seemingly-high-burn-rates.... Inc. / (second snippet line cut off at bottom edge, not legible)
Visuals: A screenshot of a Google search results page for the query 'all series a rounds in 2013', shown as a flat UI capture rather than a photograph. Its elements: the multicoloured Google wordmark at top left; a white search box containing the query; a row of tabs (Web, News, Shopping, Images, Videos, More, Search tools) with Web in red and a red underline beneath it; the results count line; and four results, each with a blue headline, a green URL line with a dropdown arrow and a grey source name, and a grey snippet. Bold marks the query words in the headlines, URLs and snippets. Result 1 is TechCrunch (headline 'The Series A Round Is The New Series B Round', dated Jun 18, 2013). Result 2 is Tech Cocktail (headline 'Bridge Rounds vs Series A Rounds', dated Sep 16, 2013). Result 3 is cbinsights.com (headline 'The 10 Largest Super-Sized Series A Rounds Hauled in ...', dated Mar 11, 2014). Result 4 is Inc. (headline 'Behind the Series B Crunch: Profligate Entrepreneurs or ...'), cut off at the bottom edge. The screenshot is cropped on the right and bottom, and a soft grey vignette shows at the outer edges.
Slide 7
Google / startups growing headcount 20% month over month / Web / News / Images / Videos / Shopping / More / Search tools / About 886,000 results (0.57 seconds) / SaaS Metrics 2.0 - A Guide to Measuring and Improving ... / www.forentrepreneurs.com/saas-metrics-2/ / Jan 16, 2013 - The faster the business decides to grow, the worse the losses become. ... Notice in the example graph that the five customer per month model ... Startups, on the other hand, typically find that capital is expensive in the ..... of leads and sales expense based on headcount but it's not perfect. ..... matrixparty-20. / SaaS Metrics - A Guide to Measuring and Improving What ... / www.forentrepreneurs.com/saas-metrics/ / Feb 17, 2010 - Detailed look at what management must focus on to drive SaaS success. ... MRR Monthly Recurring Revenue: In a SaaS business, one of the ... My own rule says that startups need to recover their cost of customer ... Growth: usually a critical success factor to gaining market leadership. ..... matrixparty-20. / Google - Wikipedia, the free encyclopedia / en.wikipedia.org/wiki/Google / Wikipedia / They incorporated Google as a privately held company on September 4, 1998. ... Rapid growth since incorporation has triggered a chain of products, ... around the world (as of 2007) and to process over one billion search requests and about 24 ... In May 2011, the
Visuals: Screenshot of a Google search results page. Logo: the multicolour Google wordmark at top left (letters in blue, red, yellow, blue, green, red). Search box: white rectangle with thin grey border containing the query 'startups growing headcount 20% month over month' and a microphone icon at the right edge, cut off. Navigation tabs: Web (active, red text with red underline bar beneath), News, Images, Videos, Shopping, More with dropdown arrow, Search tools. Results: three organic results with blue titles, green URLs with small dropdown arrows, grey dates and snippets with bolded search terms. The surrounding frame is a light grey gradient backdrop with a soft shadow along the top and left edges of the browser window. No charts or photographs.
Slide 8
Market Research today = Google + spreadsheet
Market Research of the future = data-driven answers, delivered in a format professionals can use to G.S.D.
MATTERMARK
September 2014 - confidential
Visuals: Logo: Mattermark logo at top-right, a yellow square icon (outer square yellow, inner white square with a smaller yellow square at its centre) followed by the wordmark MATTERMARK in uppercase grey sans-serif. No photographs, charts or diagrams.
Slide 9
Who needs a B2B search engine?
every knowledge worker in the world will benefit
from the most comprehensive source for answering
business questions on demand
First 6 Months
venture capitalists, angel investors, founders
Today
sales, marketing & business development professionals
Tomorrow
management consultants, analysts, researchers
Someday
investment bankers, executives, knowledge workers
September 2014 - confidential
MATTERMARK
Visuals: A four-row, two-column table with thin mid-grey (#A0A4AB) hairline borders and no fill. Column 1 (bold labels, centered): First 6 Months; Today; Tomorrow; Someday. Column 2 (regular, centered): venture capitalists, angel investors, founders; sales, marketing & business development professionals; management consultants, analysts, researchers; investment bankers, executives, knowledge workers. Column 1 occupies about 0 to 25% of table width, column 2 the remainder. No chart, photo or icon. A yellow square logo with a white inner square and small yellow centre dot, followed by the wordmark MATTERMARK, sits top-right.
Slide 10
30,000 VC & Private Equity Professionals
568,000 Sales Managers & Professionals
$3 Billion revenue opp.
in existing verticals
PROSPECTING
& LEAD
QUALIFICATION
Visuals: A single flat yellow geometric shape (a irregular pentagon/wedge) fills the lower-left area: its upper edge runs diagonally from the left edge at about 25% height down to a vertex near 45% width at about 60% height, then drops steeply to the bottom edge at about 37% width. It is a solid fill with no gradient, outline or shadow. No photographs, charts, logos or icons.
Slide 11
$125K MRR / 377% CAGR / MATTERMARK / $140,000 / $120,000 / $100,000 / $80,000 / $60,000 / $40,000 / $20,000 / $0 / 70% / 60% / 50% / 40% / 30% / 20% / 10% / 0% / MRR Growth Rate / MRR / July '13 / Aug '13 / Sep '13 / Oct '13 / Nov '13 / Dec '13 / Jan '14 / Feb '14 / Mar '14 / Apr '14 / May '14 / Jun '14 / Jul '14 / Aug '14 / Sep '14 / September 2014 - confidential
Visuals: Combo chart: vertical bars (MRR, in US dollars, left axis $0 to $140,000) plus a line with circular markers (MRR Growth Rate, in percent, right axis 0% to 70%). Horizontal gridlines at each $20,000 step. Category axis runs July '13 to Sep '14, monthly. MRR bar values are estimates (about): July '13 about $8,000; Aug '13 about $12,500; Sep '13 about $25,500; Oct '13 about $38,000; Nov '13 about $42,000; Dec '13 about $42,500; Jan '14 about $46,500; Feb '14 about $57,000; Mar '14 about $64,000; Apr '14 about $68,000; May '14 about $78,000; Jun '14 about $84,000; Jul '14 about $101,000; Aug '14 about $116,500; Sep '14 about $128,000. Growth rate line values are estimates (about): Aug '13 about 42%; Sep '13 about 56%; Oct '13 about 63% (peak); Nov '13 about 52%; Dec '13 about 31%; Jan '14 about 11% (low); Feb '14 about 16%; Mar '14 about 18%; Apr '14 about 16%; May '14 about 13%; Jun '14 about 14%; Jul '14 about 19%; Aug '14 about 21%; Sep '14 about 20%. The line has no point for July '13. Legend at top of the plot, centred: a grey circle-on-line marker followed by 'MRR Growth Rate', then a tan square followed by 'MRR'. Highlighted points: none beyond the marker style. Bars are tan with soft edges, no outlines. The line is dark grey with about 4 px stroke and hollow white-centred circle markers.
Slide 12
2015 GOAL: $10M ARR / MATTERMARK / 13.5% MRR GROWTH RATE / $900,000 / $800,000 / $700,000 / $600,000 / $500,000 / $400,000 / $300,000 / $200,000 / $100,000 / $0 / Monthly Recurring Revenue (MRR) / MRR / Sep '14 / Oct '14 / Nov '14 / Dec '14 / Jan '15 / Feb '15 / Mar '15 / Apr '15 / May '15 / Jun '15 / Jul '15 / Aug '15 / Sep '15 / Oct '15 / Nov '15 / Dec '15 / September 2014 - confidential
Visuals: Chart: vertical column chart, single series named MRR, in green. Title: none inside the chart; the slide title above serves as its heading. X axis: monthly categories from Sep '14 to Dec '15 (16 categories), labels rotated about 45 degrees, no axis title. Y axis: Monthly Recurring Revenue (MRR) in US dollars, range $0 to $900,000, labelled every $100,000, placed on the right side with horizontal gridlines at each label. Values (printed on slide: none; estimates marked about): Sep '14 about $130,000; Oct '14 about $150,000; Nov '14 about $170,000; Dec '14 about $190,000; Jan '15 about $220,000; Feb '15 about $250,000; Mar '15 about $280,000; Apr '15 about $320,000; May '15 about $360,000; Jun '15 about $410,000; Jul '15 about $470,000; Aug '15 about $530,000; Sep '15 about $600,000; Oct '15 about $685,000; Nov '15 about $780,000; Dec '15 about $880,000. Legend: top-left of plot, green square followed by MRR. Highlighted points: none; all bars share the same green and the tallest bar is Dec '15. Logo: Mattermark square icon, yellow outer square with white inner square and a small yellow centre dot, placed left of the wordmark MATTERMARK.
Slide 13
REVENUE BY USE CASE
54% OF REVENUE COMES FROM VC CUSTOMERS
MATTERMARK
Investment Banking
Merchant Bank
Academia
Angel Investing
Consulting & Research
Corporate Development
Private Equity
Business Development
Venture Capital
$1,500,000
$1,250,000
$1,000,000
$750,000
$500,000
$250,000
$0
Jul '13
Sep '13
Nov '13
Jan '14
Mar '14
May '14
Jul '14
Sep '14
September 2014 - confidential
Visuals: Chart: stacked area chart with no chart title, because the slide title serves that role. Y-axis: US dollars, linear, from $0 to $1,500,000 with gridlines every $250,000. X-axis: months from Jul '13 to Sep '14 labelled every two months (Jul '13, Sep '13, Nov '13, Jan '14, Mar '14, May '14, Jul '14, Sep '14). Series, stacked bottom to top: Venture Capital (about $75,000 at Jul '13, about $280,000 at Nov '13, about $580,000 at Jul '14, about $820,000 at Sep '14); Business Development (about $600,000 total at Sep '14 minus VC, reaching about $1,180,000 cumulative at Sep '14 top of band); Private Equity (thin band, about $30,000 to $40,000 at Sep '14); Corporate Development (about $60,000 at Sep '14); Consulting & Research (about $50,000 at Sep '14); Angel Investing (about $25,000 at Sep '14); Academia (about $15,000 at Sep '14); Merchant Bank (about $15,000 at Sep '14); Investment Banking (about $10,000 at Sep '14). Total stacked height is about $75,000 at Jul '13 and about $1,430,000 at Sep '14; no values are printed on the slide. Legend: a vertical list inside the upper-left of the plot, top to bottom: Investment Banking (grey #6F7A77), Merchant Bank (red #C7302F), Academia (green #5A9E48), Angel Investing (yellow-orange #F2B147), Consulting & Research (orange-brown #C0650F), Corporate Development (slate blue #4A6FA5), Private Equity (pale blue #8FB3DE), Business Development (purple #8077BD), Venture Capital (sky blue #63B3EA), each with a filled square swatch. No points are highlighted. The subtitle's 54% figure is the only printed highlight.
Slide 14
ARR GROWTH RATE / BIZ DEV REVENUE IS GROWING 2-3X FASTER / MATTERMARK / Venture Capital / Business Development / VC MRR Growth Rate / Biz Dev MRR Growth Rate / $70,000 / $52,500 / $35,000 / $17,500 / $0 / 90% / 80% / 70% / 60% / 50% / 40% / 30% / 20% / 10% / 0% / Jul '13 / Aug '13 / Sep '13 / Oct '13 / Nov '13 / Dec '13 / Jan '14 / Feb '14 / Mar '14 / Apr '14 / May '14 / Jun '14 / Jul '14 / Aug '14 / Sep '14 / September 2014 - confidential
Visuals: Combined bar and line chart. Bars: Venture Capital, light blue (about #C9E2F5) bars, and Business Development, pale grey-lavender (about #D9D6E3) bars, plotted against the left axis in US dollars from $0 to $70,000 (gridlines at $17,500 steps), with approximate monthly values: VC about $5,700 (Jul '13), $7,500 (Aug '13), $11,700 (Sep '13), $19,900 (Oct '13), $21,400 (Nov '13), $21,800 (Dec '13), $25,100 (Jan '14), $31,600 (Feb '14), $32,900 (Mar '14), $35,000 (Apr '14), $38,900 (May '14), $43,100 (Jun '14), $48,800 (Jul '14), $61,800 (Aug '14), $65,100 (Sep '14). BD bars about $0 (Jul '13), $400 (Aug '13), $1,100 (Sep '13), $1,400 (Oct '13), $1,600 (Nov '13), $2,000 (Dec '13), $2,900 (Jan '14), $3,100 (Feb '14), $6,100 (Mar '14), $7,500 (Apr '14), $10,500 (May '14), $15,200 (Jun '14), $21,300 (Jul '14), $25,500 (Aug '14), $36,600 (Sep '14). Lines: VC MRR Growth Rate, teal-blue (about #7DBCD9) line with open circle markers, right percentage axis 0% to 90% in 10% steps; approximate values: Aug '13 about 33%, Sep '13 about 44%, Oct '13 about 53%, Nov '13 about 44%, Dec '13 about 27%, Jan '14 about 8%, Feb '14 about 14%, Mar '14 about 15%, Apr '14 about 12%, May '14 about 7%, Jun '14 about 9%, Jul '14 about 12%, Aug '14 about 17%, Sep '14 about 15%. Biz Dev MRR Growth Rate, purple (about #9B7FD1) line with open circle markers; approximate values: Oct '13 about 86%, Nov '13 about 59%, Dec '13 about 29%, Jan '14 about 20%, Feb '14 about 20%, Mar '14 about 43%, Apr '14 about 42%, May '14 about 53%, Jun '14 about 35%, Jul '14 about 42%, Aug '14 about 35%, Sep '14 about 35%. Series start at Aug '13 for VC and Oct '13 for Biz Dev is not shown; the Biz Dev line starts at Oct '13 while VC starts at Aug '13. Legend: four entries in a 2 by 2 grid, a light blue bar swatch for Venture Capital, a grey-lavender swatch for Business Development, a teal circle-line swatch for VC MRR Growth Rate, and a purple circle-line swatch for Biz Dev MRR Growth Rate. No values are printed on the chart; all numbers above are estimates. Highlighted points: none. Gridlines are thin mid-grey horizontal lines at each left-axis step.
Slide 15
Core Questions to Answer
MATTERMARK
September 2014 - confidential
Visuals: One logo: the Mattermark mark, a yellow square with a smaller yellow-filled square inside it, followed by the wordmark MATTERMARK in dark grey uppercase sans-serif. No photographs, charts or other graphics.
Slide 16
How do we optimize / our supply chain?
What new vertical / should we enter?
How do we optimize / via financial instruments?
How do I return / value to / shareholders?
What new product / should I build?
Who do we need to / hire/acquire to build it?
Who should we / do business with?
Visuals: Seven chevron-style block arrows drawn as thin grey outlines with no fill, each pointing clockwise around a central open space. Six arrows are grey #808080 at about 1.5 pt stroke. The arrow at upper left of the ring, between the labels 'What new vertical' and 'Who should we', is outlined in yellow #F5C842 at about 1.5 pt stroke and points up and to the right; it is the highlighted point that matches the bold label 'Who should we do business with?'. There are no photographs, charts, icons or logos.
Slide 17
DATA WE NEED
Suppliers
Manufacturers
Distributors
Market Size
Pricing
Competitors
Equities
Bonds
Cash Equivalents
Invest
Customer
Partner
IPO
Dividend
Re-investment
M&A
Recruiting
New Product
Development
Visuals: Seven open block arrows in a clockwise-rotating ring around the centre, drawn as thin yellow outlines with no fill so the background shows through. Upper-left arrow points up-right; top-right arrow points down-right; right arrow points down; lower-right arrow points down-left; bottom arrow points left; lower-left arrow points up-left; left arrow points up. Each arrow is about 2 px yellow (#F5C842) outline with sharp mitred corners. No photographs, charts, logos or icons.
Slide 18
Suppliers
Manufacturers
Distributors
MANAGEMENT
CONSULTING
Market Sizing
Pricing
Competitors
Equities
Bonds
Cash Equivalents
INVESTMENT
BANKING
IPO
Dividend
Re-investment
WHO
NEEDS IT
Investment
Customer
Partner
BUSINESS
DEVELOPMENT
M&A
Recruiting
RESEARCH &
DEVELOPMENT
New Product
Development
Visuals: Four flat filled wedge shapes radiating from the centre, with faint outlined arrows overlaid. Upper-left red wedge bounded by a diagonal edge running from left edge at about y 34% down to the centre and up to the top edge at about x 67%. Upper-right slate wedge bounded by a diagonal from top edge at about x 67% down to the centre and out to the right edge at about y 87%. Lower-left yellow wedge bounded from left edge at about y 34% to centre and down to bottom edge at about x 37%. Lower-right olive wedge bounded from centre to bottom edge at about x 37% and out to the right edge at about y 87%. Outlined arrows: about 12 hollow chevron-style arrows, stroked about 2 px in a slightly darker tone of the wedge colour they cross, pointing up, down or diagonally, partly overlapping the wedges and text. No photographs, logos, charts or icons.
Slide 19
a.k.a BUSINESS PEOPLE
Suppliers
Manufacturers
Distributors
MANAGEMENT
CONSULTING
Market Clients
Competitors
Equities
Bonds
Cash Equivalents
INVESTMENT
BANKING
WHO
NEEDS IT
Investors
Customers
Partner
BUSINESS
DEVELOPMENT
IPO
Dividend
Re-investment
M&A
Recruiting
RESEARCH &
DEVELOPMENT
Visuals: A full-bleed abstract faceted illustration of four or five angular polygonal planes in dark slate and muted blue-grey tones, with a darker purple-grey upper-left facet, a blue-grey upper-right facet, a mid-grey left facet and a dark slate-blue lower facet. Overlaid across the whole image is a dark grey translucent tint that dims the facets. Printed faintly within the facets, at low contrast, are text labels: 'Suppliers', 'Manufacturers', 'Distributors' (top centre); 'MANAGEMENT CONSULTING' with 'Market Clients' and 'Competitors' (upper left); 'Equities', 'Bonds', 'Cash Equivalents', 'INVESTMENT BANKING' with 'IPO', 'Dividend', 'Re-investment' (right); 'WHO NEEDS IT' (centre, partly behind title); 'Investors', 'Customers', 'Partner', 'BUSINESS DEVELOPMENT' (left); 'M&A', 'Recruiting', 'RESEARCH & DEVELOPMENT' (lower centre and right). No photographs, logos or icons. The image is not cropped and has no border.
Slide 20
500K+ COMPANIES
CURRENTLY TRACKED BY MATTERMARK
600,000
500,000
400,000
300,000
200,000
100,000
0
Apr '13 Jun '13 Aug '13 Oct '13 Dec '13 Feb '14 Apr '14 Jun '14 Aug '14
Visuals: Vertical bar chart, untitled apart from the slide headline. Y axis: 0 to 600,000 companies, linear, gridlines at every 100,000, labels 0, 100,000, 200,000, 300,000, 400,000, 500,000, 600,000. X axis: monthly periods Apr '13 to Sep '14 (18 bars), with labels printed under Apr '13, Jun '13, Aug '13, Oct '13, Dec '13, Feb '14, Apr '14, Jun '14 and Aug '14; the bars between labels are unlabelled months. One series, companies tracked, values not printed, so estimates are marked about: Apr '13 about 110,000; May '13 about 111,000; Jun '13 about 120,000; Jul '13 about 126,000; Aug '13 about 142,000; Sep '13 about 150,000; Oct '13 about 168,000; Nov '13 about 175,000; Dec '13 about 181,000; Jan '14 about 190,000; Feb '14 about 198,000; Mar '14 about 218,000; Apr '14 about 226,000; May '14 about 233,000; Jun '14 about 240,000; Jul '14 about 249,000; Aug '14 about 270,000; Sep '14 about 509,000. No legend and no highlighted points, although the final bar is visibly the tallest, roughly twice the previous month. Bars are flat, unoutlined, evenly spaced, with a narrow gap between them and a slight soft edge. Gridlines are thin light grey horizontal rules spanning the plot width, and the baseline is a slightly darker grey rule.
Slide 21
WE FOUND A WAY / TO GO FASTER
Slide 22
PACE: 3M COMPANIES
BY SEPTEMBER 2015
4,000,000
3,500,000
3,000,000
2,500,000
2,000,000
1,500,000
1,000,000
500,000
0
Apr '13
July '13
Oct '13
Jan '14
Apr '14
Jul '14
Oct '14
Jan '15
Apr '15
Jul '15
Visuals: Chart: vertical bar chart of cumulative companies (3M companies) by month, with 30 bars from Apr '13 to Sep '15 (one bar per month). Y-axis title: none printed; values are counts with range 0 to 4,000,000 in steps of 500,000 (gridlines at every 500,000). X-axis: monthly periods labelled Apr '13, July '13, Oct '13, Jan '14, Apr '14, Jul '14, Oct '14, Jan '15, Apr '15, Jul '15, at every third bar. No values are printed on the bars, so the values below are estimates marked about. Series: single series, bars in order, about 105,000 (Apr '13), about 105,000 (May '13), about 115,000, about 125,000, about 135,000, about 145,000, about 165,000, about 170,000, about 180,000, about 190,000, about 190,000, about 215,000, about 225,000, about 230,000, about 235,000, about 250,000, about 265,000 (bar 17, Sep '14 area), about 500,000, about 735,000, about 970,000, about 1,200,000, about 1,430,000, about 1,660,000, about 1,880,000, about 2,110,000, about 2,340,000, about 2,570,000, about 2,810,000, about 3,040,000, about 3,270,000 (last bar, Sep '15). Legend: none. Highlighted points: none; the final bar is the tallest and no other bar is marked. Bars are a uniform steel blue with no data labels.
Slide 23
LEADERSHIP TEAM
September 2014 - confidential
Visuals: One logo mark, centred horizontally, made of three nested flat squares. The outer square is golden yellow (#F8CB2F) and measures about 17.6% of slide width by 23.5% of slide height, with its top-left corner at 41.2%, 24.3%. Inside it is a white square (#FFFFFF) with its top-left corner at 44.4%, 29.3% and size about 11.5% by 14.3%. At its centre is a smaller bright yellow rectangle (#FDE32F), about 5.2% by 5.2%, top-left at 47.6%, 34%. Edges are sharp with no rounded corners, shadows or gradients on the mark. No photographs, charts or other graphics.
Slide 24
DANIELLE MORRILL, CEO & COFOUNDER
Director of Marketing
First employee. Build and lead the marketing teams and acquired the first 100,000 customers.
Community Manager
Mobile location-based social checkin app started in the pre iPhone world. Among first 10 iPhone apps.
Business Process Analyst
Automated manually processes through software.
Reliant Consulting & Research
Financial Analyst
Visuals: Photograph of a woman with long strawberry-blonde hair, smiling with closed lips, facing the camera, head and shoulders framed in a near-square crop; background shows a blue-lit office with dark vertical panels and an orange chair edge at lower left. Warm skin tones and blue background dominate. Photo is boxed with hard square corners, not full-bleed. Logos: Twilio logo (grey-ringed circle with four dots, two red and two grey, followed by red bold lowercase wordmark 'twilio'); whrrl v2.0 logo (green swirl icon followed by grey wordmark 'whrrl' with bracket and small 'v2.0'); Expeditors logo (black serif 'Expeditors' wordmark with red flag accent above and tagline 'You'd be surprised how far we'll go for you.' in small type beneath).
Slide 25
KEVIN MORRILL, CTO & COFOUNDER
Startup Founder & Software Engineer
Kevin cofounded health communications technology company Capito Life, cofounded Referly and worked as a software engineer for HelloSign.
Senior Program Manager, Sharepoint
Lead Program Manager, Developer Division
Kevin joined Microsoft in 1999 as a high school intern. He worked with the company for 10 years as an engineer and program manager across Visual Studio, .NET and Office (Sharepoint).
Visuals: Photograph of a smiling man with short brown hair in a light blue collared shirt, head and shoulders, framed as a boxed rectangle with square corners, set against a grey textured wall; no crop beyond the shoulders, soft even frontal lighting. Logos: HelloSign logo (white wordmark with a small triangle icon on a bright sky-blue #4AB4E6 rectangle); a purple square #6B2C91 with a white serif letter R; Capito Life Technologies logo (dark green 'Capito' wordmark, green concentric swirl icon, 'Life Technologies' in lime green, tagline 'The Power to Engage' on white). Microsoft logo: four-square Windows-style mark in red #F25022, green #7FBA00, blue #00A4EF and yellow #FFB900 with grey 'Microsoft' wordmark #737373.
Slide 26
ANDY SPARKS, COO & COFOUNDER
CEO & Cofounder
Lead creation of website for tracking release of movies, TV shows and video games. Acquired by Referly (nee Mattermark) in February 2012.
Visuals: Photograph: a head-and-shoulders portrait of a smiling man with short blond hair, black-rimmed rectangular glasses and a dark navy collared shirt, set against a blurred grey-blue sea and sky. Framing is near-square and tightly cropped at the shoulders, boxed with no border, under soft even daylight. Dominant colours are navy, blond, and cool grey. Logo: the LaunchGram wordmark in white serif capitals on a flat charcoal rectangle, with a small square-stacked icon at its right end that has a yellow-orange accent at its lower left. No charts, tables or other visuals.
Slide 27
BRYAN TSAO, DIRECTOR OF PRODUCT
Director of Product Management
Joined Kabam pre-revenue and spent 6 years helping grow the company to a $1 Billion+ valuation. Owned P&L and product strategy for a portfolio of games with eight figure annual bookings and managed a 70 person cross-functional team.
Design
Avi
Visuals: Photograph of a smiling man with short dark hair, dark sunglasses and a dark suit jacket with a grey-blue checked shirt and dark tie, laughing and turned to the left, against a pale cream wall with faint horizontal lines. Framed as a square crop with the subject from the head to mid-chest, boxed with no border, sitting at the upper left. Soft even lighting, dominant colours cream, charcoal and grey-blue. Logo: KABAM, a cartoon black bomb with a lit orange-yellow fuse and an orange-to-yellow gradient wordmark with a dark outline, placed to the right of the photo at the top of the text column. A grey rectangle at the bottom left holds the text 'Avi' in white light sans-serif.
Slide 28
DANIEL HAYTER, VP OF SALES
DOW JONES
Head of Institutional Sales, Americas
Spearheaded $270 million business in corporate, financial, and private market products, overseeing P&L and reporting directly to CEO.
Bloomberg
Managing Director, Bloomberg Law Sales
European Financial Markets Sales
Completed 2 of Bloomberg's largest deals, generating $60m in revenue over 5 years
Sales Executives
Inside Sales
Account Managers
Naveen
Ravi
Taylor
Wade
Ray
Lisa
TBH
Visuals: Photograph of a smiling man with short greyish-brown hair, navy blazer and light blue striped open-collar shirt, against a blurred background of yellow and green bokeh foliage; boxed square crop with sharp corners, not full-bleed, no overlay, warm yellow-green dominant colours. Dow Jones logo: bold black wordmark 'DOW JONES' with the 'O' and 'N' partly in blue. Bloomberg logo: orange wordmark 'Bloomberg' with thin darker orange outline. Bottom band contains 6 grey rectangles with white-ish labels: Naveen, Ravi, Taylor, Wade, Ray, Lisa, plus one outlined empty box labelled TBH (grey outline on light background, no fill).
Slide 29
SARAH CATANZARO, DATA TEAM LEAD
Palantir
Embedded Analyst, New York City government
implemented data integration and analytics solutions
enabling municipal agency investigations
Cyveillance
Cyber Intelligence Analyst
Center for Advanced Defense Studies
Program Director, Multiparadigmatic
Approaches to National Security
Data Scientists
Business Analysts
Technical Analyst
Clare
Samiur
Kevin
Josh
Tristan
Visuals: Photograph of a smiling woman with long brown hair, lit by warm low sunlight from the right, with a blurred urban background of metal structures and sky at top; the photo is a square crop with sharp edges, boxed and not full-bleed, placed at the left below the title. Logo of Palantir: a stylised circular 'O' outline with a tail above the word Palantir in dark grey. Logo of Cyveillance: a pale blue oval globe-like emblem with a central eye motif, placed to the left of the bold word Cyveillance. Bottom band contains nine-square grey boxes: Clare, Samiur under Data Scientists; Kevin, Josh under Business Analysts; Tristan under Technical Analyst, each box a flat mid-grey square with white text.
Slide 30
MATTERMARK / companies in motion / September 2014 - confidential
Visuals: Logo: a square mark made of concentric shapes. Outer square in golden yellow (#F8CB2F approx.) spanning about x 41-59%, y 22-43%; inside it a white square (#FFFFFF) with a small yellow rectangle (#FDE231 approx.) at its centre. No photographs, charts or other graphics.
Download this deck
The hosted PDF of every library deck is free for readers of the SlideDeck Co newsletter. Join with your email and the viewer and download appear here.
Building a pitch deck of your own? The SlideDeck Co Startup Deck is a slide library with a worked investor pitch and financial model.