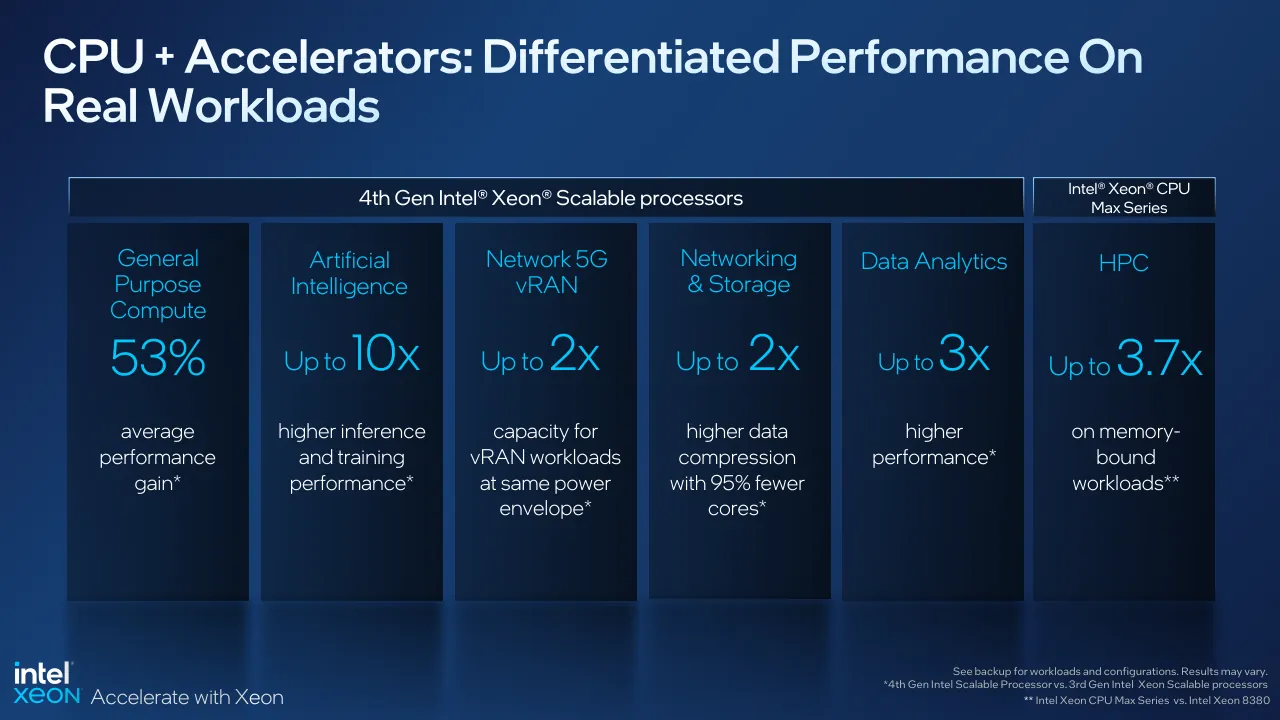
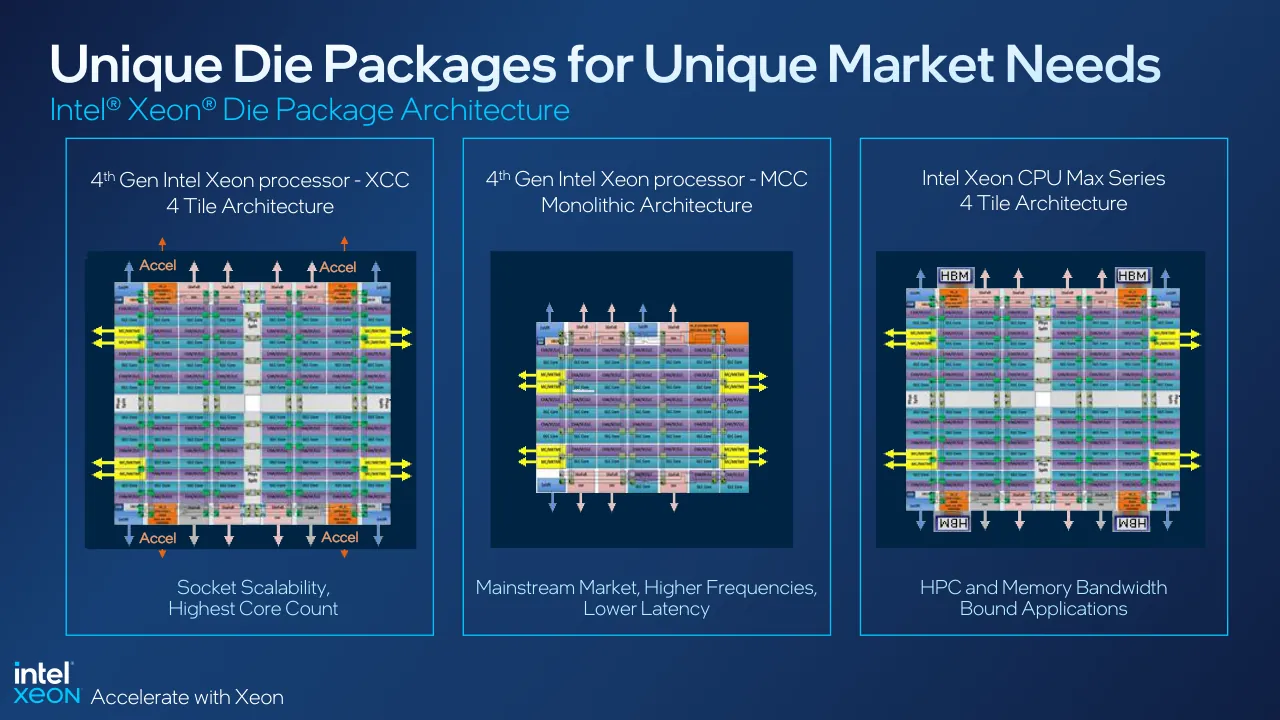
This sales deck introduces the 4th Gen Intel Xeon Scalable processors and the Intel Xeon CPU Max Series. It opens with a headline slide of performance claims across general compute, AI, 5G vRAN, data analytics, HPC, and networking and storage, then repeats that summary with power and emissions figures. The middle sections cover the platform in detail: architecture and die packaging, memory and interconnect specifications, the built-in accelerators (AMX, DSA, IAA, DLB, QAT), and the security features. Later sections present workload benchmarks against the 3rd Gen parts, a fleet-level total cost of ownership comparison, a high-bandwidth-memory section, and customer quotes. The deck closes with a summary of its claims, a product comparison table, and extensive benchmark configuration notes in the backup. Most slides are dense with footnoted test results, and the layout relies on bar charts and tables. Slides worth studying are the opening overview, the die-package comparison, the accelerator benefit slides, and the TCO table, which lays out assumptions side by side.
Slides worth studying
Questions about this deck
What performance gain does the Intel deck report for general purpose compute?
Slide 2 reports a 53% average performance gain for general purpose compute, comparing 4th Gen Intel Xeon Scalable processors with 3rd Gen Intel Xeon Scalable processors. Slide 19 repeats the same 53% figure.
How many slides does the Intel 4th Gen Xeon Scalable presentation deck have?
The Intel deck has 69 pages in total. Slide 1 is the title slide, headed Accelerate with Xeon and dated January 10.
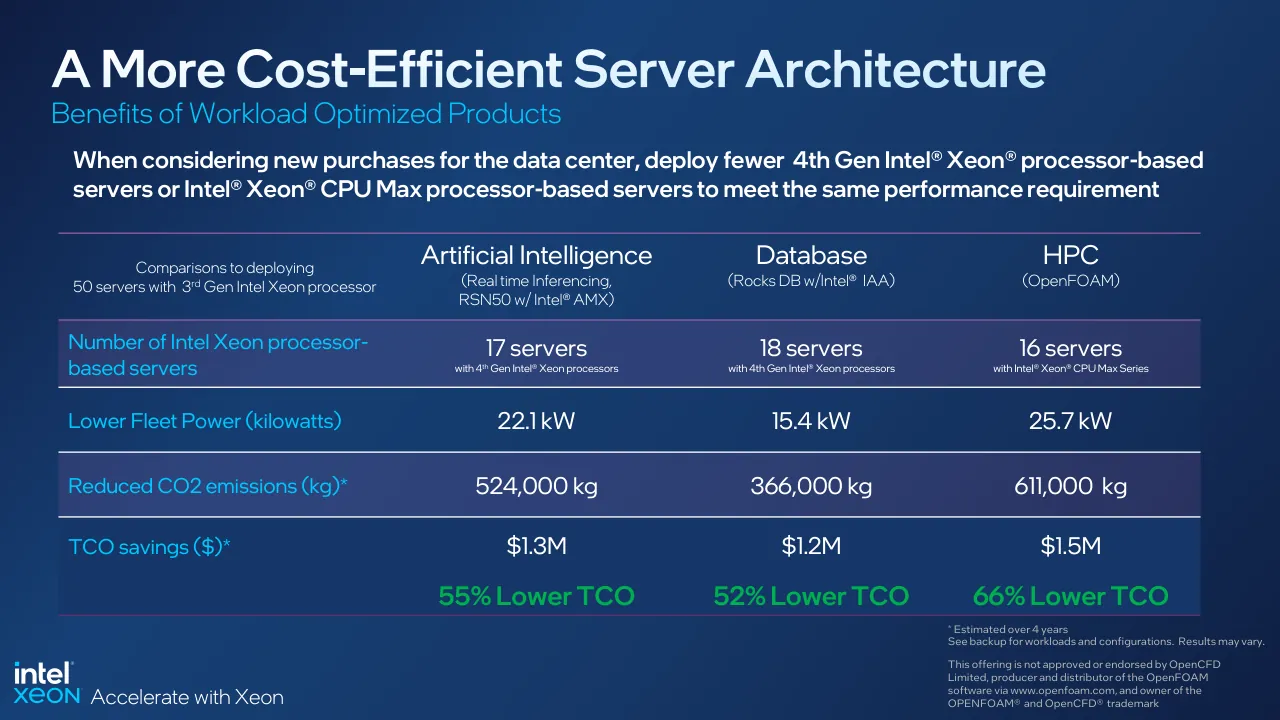
What total cost of ownership savings does the Intel deck show for the HPC scenario?
Slide 22 shows a 66% lower TCO for HPC (OpenFOAM), with 16 servers with Intel Xeon CPU Max Series, 25.7 kW of fleet power, and $1.5M in TCO savings. The slide notes that these figures are estimated over 4 years.
Which built-in accelerators does the Intel deck list for its 4th Gen Xeon Scalable processors?
Slide 4 lists the Intel In-Memory Analytics Accelerator (Intel IAA), Intel Data Streaming Accelerator (Intel DSA), Intel Dynamic Load Balancer (Intel DLB), and Intel QuickAssist Technology (Intel QAT). It also lists Intel Advanced Matrix Extensions (AMX) among the integrated ISA accelerators.
Details
- Company: Intel
- Year: 2022
- Type: Sales deck
- Industry: Semiconductors
- Pages: 69
More from Intel
All Intel decks in the library
Review score: 7 out of 10, Effective
Presentation quality, judged with the SlideDeck Co review heuristic. Ask, evidence and idea merit are not rated here.
The deck has a clear, consistent system: dark blue template, cyan headings, large key numbers, and a headline claim set on slide 2 that later sections repeat and support. Readable slides such as 2, 8 and 22 have a clear subject, strong hierarchy and tidy alignment, and the TCO table on slide 22 is easy to scan with the savings percentages picked out in green. Weaknesses are consequential: slides 4, 5, 10 and 12 pack in tiny labels, several benchmark charts (slides 18, 20, 24, 26) have axis labels too small to read, and about 30 backup slides are walls of microtext. The long middle also repeats the same summary slide several times, and slide 2 shows only bare multipliers with footnote-level comparison baselines.
Worth keeping: Keep the large cyan stat callouts and the side-by-side table layout of slide 22, plus the consistent template that makes the deck feel unified.
Most useful repair: Cut the small labels on the platform diagram slides and the rotated axis labels on the benchmark charts down to what the audience can read, and make each benchmark chart carry one stated takeaway.
What would change the score: I would remove the repeated summary slides and split or trim the backup configuration pages so the main route is shorter and each page earns its place.
Confidence medium. 69 of 69 pages inspected on contact sheets, 4 at readable size. Reviewed 2026-11-08. Model-assisted review (claude-sonnet-5-5).
Full text of the slides (69 slides)
Every slide's words and a description of its charts and images, so the deck can be searched and rebuilt. Also available as Markdown.
Slide 1
intel® / XEON® / Accelerate with Xeon / January 10
Visuals: Photograph of a young man in a data centre aisle. He stands full length, facing the camera, with his hands in his pockets, wearing a yellow-green crew-neck sweater over a white collared shirt with a patterned tie, dark grey distressed jeans and brown loafers. Server racks line both sides of a receding aisle with ceiling light panels above. The lighting is cool, from overhead panels, and the palette is dark navy, teal-grey and the yellow-green sweater. Framing is a low-angle full-length shot, cropped to fill the slide. A thin light-blue (#4FC3F7-like) rectangular outline box, about 1.5 px stroke with square corners, is drawn around the man's head and upper torso at the top right, roughly x 60% to 81%, y 3% to 35%; it is an unfilled frame with no fill. A dark gradient overlay darkens the left half of the photograph, where the logo sits.
Slide 2
CPU + Accelerators: Differentiated Performance On / Real Workloads / 4th Gen Intel® Xeon® Scalable processors / Intel® Xeon® CPU / Max Series / General / Purpose / Compute / 53% / average / performance / gain* / Artificial / Intelligence / Up to 10x / higher inference / and training / performance* / Network 5G / vRAN / Up to 2x / capacity for / vRAN workloads / at same power / envelope* / Networking / & Storage / Up to 2x / higher data / compression / with 95% fewer / cores* / Data Analytics / Up to 3x / higher / performance* / HPC / Up to 3.7x / on memory- / bound / workloads** / Accelerate with Xeon / See backup for workloads and configurations. Results may vary. / *4th Gen Intel Scalable Processor vs. 3rd Gen Intel Xeon Scalable processors / ** Intel Xeon CPU Max Series vs. Intel Xeon 8380
Visuals: Six dark rectangular panels, each with a cyan label, a large cyan metric and a white descriptor. Column 1 'General Purpose Compute' shows '53%' with 'average performance gain*'. Column 2 'Artificial Intelligence' shows 'Up to 10x' with 'higher inference and training performance*'. Column 3 'Network 5G vRAN' shows 'Up to 2x' with 'capacity for vRAN workloads at same power envelope*'. Column 4 'Networking & Storage' shows 'Up to 2x' with 'higher data compression with 95% fewer cores*'. Column 5 'Data Analytics' shows 'Up to 3x' with 'higher performance*'. Column 6 'HPC' shows 'Up to 3.7x' with 'on memory-bound workloads**'. Each panel has a faint dark reflection below its bottom edge, about 19% of slide height tall. No chart, table or photograph is present. The Intel Xeon logo is a white wordmark 'intel' above a cyan 'XEON' wordmark.
Slide 3
CPU + Accelerators: Groundbreaking Efficiency
Higher Performance
per Watt
2.9x
average improvement
of perf/watt with
built-in accelerators*
Lower
Power Bills
up to 70W
power savings per
CPU with Optimized
Power Mode
Lower TCO
More Sustainable
55%
lower TCO and power
consumption
while reducing 524K kg
of CO2 emissions*
AI Real Time Inferencing workload, ResNet50
intel XEON
Accelerate with Xeon
See backup for workloads and configurations. Results may vary.
*for selected workloads.
*4th Gen Intel® Xeon® Scalable Processor vs. 3rd Gen Intel Xeon Scalable processors.
Visuals: No charts, photographs or diagrams. Three dark rectangular panels with a soft vertical gradient and a faint dark reflection (shadow) beneath each, fading into the background. A small Intel XEON logo at bottom left: the word intel in white with a registered mark, and XEON in cyan #00C7FD. Card 1 shows the figure 2.9x. Card 2 shows 'up to' in small type followed by 70W. Card 3 shows 55%. The large figures are the only emphasised values; no highlighted points or legend.
Slide 4
Intel's Most Feature Rich Server Platform / 4th Gen Intel® Xeon® Scalable Processors and Intel® Xeon® CPU Max Series Processors / New Integrated IP Accelerators / Increased I/O Bandwidth with PCIe 5.0 / Compute Express Link (CXL) 1.1 / 4th Gen Intel Xeon Scalable Processor Intel Xeon CPU Max Series / Intel® In-Memory Analytics Accelerator (Intel® IAA) / Intel® Data Streaming Accelerator (Intel® DSA) / Intel® Dynamic Load Balancer (Intel® DLB) / Intel® QuickAssist Technology (Intel® QAT) / PCIe 5.0/4.0 Up to 80 Lanes / 1 to 8 Socket Support / Intel® In-field Scan ** / Intel® Seamless Firmware Update / High Bandwidth Memory Support / intel XEON / 8 DMI 4.0 LINKS / Intel® C741 Chipset / Intel® Advanced Matrix Extensions (AMX) / Accelerating Interfacing Architecture (AiA) / Intel® Advanced Vector Extensions for vRAN / Enhanced Intel® Software Guard Extensions / 8 Channel DDR5 / Up To 4800 MT/s (1DPC) / Up To 4400 MT/s (2DPC) / 16 DIMMS per Socket / New RAS features (Enhanced ECC, Error Check & Scrub) / Intel® Ultra Path Interconnect (Up to 4 Links @ 16 GT/s) / Optimized Power Mode / New Integrated ISA Accelerators / HW-Enhanced Security / Increased Memory Bandwidth with DDR5 / Increased Inter-Socket Bandwidth with UPI 2.0 / Intel® Optane™ Persistent Memory 300 Series / Intel® Agilex™ FPGAs / Intel® Data Center GPU Max Series Intel® Data Center GPU Flex Series / Intel® Infrastructure Processing Unit (Intel® IPU) / intel XEON Accelerate with Xeon / * Enabled for WorkStation + vPro SKUs ONLY / ** Intel In-Filed Scan is a new capability available through select providers in 2023
Visuals: Technical block diagram with icons. Centre: a dark navy square processor block (about x 40.8 to 56.3%, y 25.8 to 53.4%) showing the intel logo top-left and a large XEON wordmark, with a cyan glow outline. Below it, a light grey square labelled Intel® C741 Chipset (about x 44.1 to 53.2%, y 58.9 to 75%), connected to the processor by a vertical cyan line labelled 8 DMI 4.0 LINKS. Left column of thin-line cyan icons (about #00C7FD) beside labels: a chip icon for DSA (about x 36.1, y 29.4), a PCIe card icon beside PCIe 5.0/4.0, a network-cube icon for 1 to 8 Socket Support, a gauge icon for In-field Scan, and a memory stick icon for High Bandwidth Memory Support. Right column of cyan icons: a head with gears for AMX, a 5G symbol for AiA/vRAN, a shield with checkmark for Software Guard Extensions, a DIMM module for DDR5, a node network for Ultra Path Interconnect, and a square-outline power symbol for Optimized Power Mode. No photographs.
Slide 5
INTRODUCING
4th Gen Intel® Xeon® Scalable Processors
Workload-First Approach to Innovation, Design and
Delivery
Most Built-In Accelerators of any CPU in the Market
with Leading Performance in AI, Analytics,
Networking, Storage, Security, and HPC
Intel’s Most Sustainable Data Center
Processor Ever
In customer hands and delivering real-world results today
intel XEON
Accelerate with Xeon
Visuals: One photograph of a silver Intel Xeon processor module (4th Gen Intel Xeon Scalable Processor) placed at x 59.8%, y 25.9%, 35.7% by 51.9% (671 by 549 px). The module is tilted about 20 degrees clockwise, shown at three-quarter top view on a dark blue background, with brushed silver metal lid, a small gold-edged green circuit substrate along its lower edge, and the printed text intel. XEON, 4th Gen Intel Xeon Scalable Processor on the lid. Lighting is soft and top-lit, making the metal highlights bright and the lid edges grey-white. The photograph is boxed as a rectangle with no crop beyond its edges and no tint. Three dark translucent horizontal bands (approx #071A33 at about 60% opacity) run from the left edge to x 94.9%, at y 25.6% (h 16.1%), y 42.6% (h 16.3%) and y 59.8% (h 16.1%), separated by thin lighter blue gaps approx #1E4D8A. A thin cyan (#00C7FD) bracket outline, 0.2% stroke, runs from the top-left corner at (5.2%, 22.6%) down to (5.2%, 74%) and across the bottom to (89.6%, 77.4%), with a matching vertical line at x 90.4% from y 22.6% to 74.1% and short horizontal segments at the top. A square tile with the intel XEON logo in white and cyan at x 86.5%, y 68.3%, 7.7% by 13.7%, filled with a blue gradient (#1A4D8C to #0B2A55). A horizontal caption pill at x 5.2%, y 84.4%, 88.9% by 5.6%, filled with a dark-to-mid blue gradient (#052B57 to #0A1F40). Bottom-left intel XEON logo: intel in white over XEON in cyan #00C7FD.
Slide 6
Built for Better Node & Data Center Performance
Scalar
Performance
Data Parallel
Performance
Cache & Memory Sub-System
Architecture
Intra/Inter Socket Scaling
Node Performance
Infrastructure & Framework
Overhead
Consolidation
& Orchestration
Performance
Consistency
Elasticity & Efficient
Data Center Utilization
Data Center Performance
Security-by-Design Foundation
intel
XEON
Accelerate with Xeon
4th Gen
Intel Xeon Scalable Processor
Visuals: Photograph of an Intel Xeon 4th Gen Scalable Processor, shown as a silver rectangular chip package (portrait orientation, about 1053 by 1388 pixels) centred between the two columns, boxed with no border, in front of the dark blue background. The chip has a brushed silver metal lid with rounded corners, gold contact pads along the top and bottom edges, and printed text on the lid: intel logo in dark grey (top left), XEON wordmark in large dark grey letters, then 4th Gen and Intel Xeon Scalable Processor in smaller dark grey text. Lighting is even and frontal, with soft highlights on the metal. Dominant colours are silver grey and dark grey with green-tinted substrate edges. Eight boxes: four left column dark navy rectangles and four right column dark navy rectangles, each with a subtle dark gradient from navy to near-black, and two vertical side bars with thin light-cyan outlines (#00C7FD) and the horizontal bottom bar with a thin cyan outline. Logo at bottom left: intel wordmark in white over XEON in cyan (#00C7FD).
Slide 7
Delivering Better Node & Data Center Performance
New or Enhanced Capabilities
Node Performance
Intel P-Core Microarchitecture
4-Tile & Monolithic Architecture
ISA and IP Accelerators
Accelerator Interface Architecture
Low Jitter Architecture
Workload Optimized SKUs
Optimized Power Mode
Platform Monitoring Technology
Resource Director Technology
In-field Scan**
Intel® On Demand
Seamless Firmware Update
Data Center Performance
Security-by-Design Foundation
Intel® Software Guard Extensions (Intel® SGX), Intel® Trust Domain Extension (Intel® TDX)*,
Intel® QuickAssist Technology (Intel® QAT), Intel® Control-flow Enforcement Technology
Accelerate with Xeon
* Intel TDX is a new capability available through select cloud providers in 2023
** Intel In-Filed Scan is a new capability available through select providers in 2023
Visuals: One photograph of an Intel 4th Gen Xeon Scalable Processor: a vertical silver metallic CPU package seen straight on, with the intel XEON wordmark in dark grey near its upper third, and the text 4th Gen / Intel Xeon Scalable Processor in dark grey below it. The package fills about 31% of slide width and 73% of slide height, centred horizontally, cut out on the navy background with no box or border, lit by soft even studio light with highlights on the silver lid and a faint shadow. Dominant colours: silver grey, dark grey, with green PCB edges. Twelve tile rectangles (six left, six right) and two vertical label bars are dark navy with thin light-blue outlines. One outlined security box spans the lower centre. Bottom-left Intel XEON logo in white and light blue.
Slide 8
Unique Die Packages for Unique Market Needs
Intel® Xeon® Die Package Architecture
4th Gen Intel Xeon processor - XCC / 4 Tile Architecture
Accel
Accel
Accel
Accel
4th Gen Intel Xeon processor - MCC / Monolithic Architecture
Intel Xeon CPU Max Series / 4 Tile Architecture
HBM
HBM
HBM
HBM
Socket Scalability, / Highest Core Count
Mainstream Market, Higher Frequencies, / Lower Latency
HPC and Memory Bandwidth / Bound Applications
intel XEON Accelerate with Xeon
Visuals: Three die-package diagrams, each a top-down schematic drawn on a dark navy #002543 square. Left: 4th Gen Intel Xeon XCC (labelled '4 Tile Architecture'), a large die of about 8 columns by 12 rows of tiles. It shows light blue 'CPU Core' cells, lilac/purple 'CHA/SF/LLC' cells, pale pink and grey 'IMC/UPI' strips along the top and bottom edges, a grey vertical mesh strip down the centre, and orange corner blocks labelled as accelerator tiles. Yellow 'MC/IMC/PHY' blocks sit on the left and right edges with yellow arrows pointing outwards. Orange 'Accel' labels with small orange arrows sit at the top and bottom corners of the die, and blue, pink and grey arrows run along the top and bottom edges. Middle: 4th Gen Intel Xeon MCC Monolithic, a smaller single die of about 10 columns by 10 rows with the same colour coding, a yellow 'MC/IMC/PHY' block on each side with yellow arrows, and blue, pink and grey I/O arrows along the top and bottom edges. Right: Intel Xeon CPU Max Series, 4 tile die with the same grid, plus four grey boxes labelled 'HBM' at the top and bottom corners (two rotated 180 degrees at the bottom), with yellow MC/IMC blocks and arrows on both sides. Each diagram is boxed by its dark navy image rectangle, not cropped, and is lit flat with no shadows.
Slide 9
Die Package Details
Features
4th Gen Intel® Xeon® Scalable Processors
Intel® Xeon® CPU Max Series
Extreme Core Count (XCC)
Medium Core Count (MCC)
High Bandwidth Memory (HBM)
Die Construction
4 tiles connected using MDF over Intel Embedded Multi-die Interconnect Bridge (EMIB)
1 monolithic chip
4 tiles connected using MDF over Intel Embedded Multi-die Interconnect Bridge (EMIB)
Core Count
Up to 60 active cores
Up to 32 active cores
Up to 56 active cores
TDP Range
225 to 350W
125 to 350W
350W
Memory
DDR5 @ 4800 (1 DPC), 4400 (2DPC), 16 Gb DRAM, 8 Channels
Intel® Optane™ PMem 300 (Crow Pass) @4400 MT/s
DDR5 @ 4800 (1 DPC), 4400 (2DPC), 8Channels
64 GB HBM2e memory with up to 1.14 GB/core
Intel UPI
UPI 2.0 @ 16 GT/s, up to 4 Ultra Path Interconnects
UPI 2.0 @ 16 GT/s, up to 3 Ultra Path Interconnects
UPI 2.0 @ 16 GT/s, up to 4 Ultra Path Interconnects
Scalability
1 Socket, 2 Socket, 4 Socket, 8 Socket
1 Socket, 2 Socket, 4 Socket
1 Socket, 2 Socket
PCIe/Compute Express Link
PCIe 5.0 (80 lanes),
Up to 4 devices supported via Compute Express Link (CXL) 1.1
Security
Intel® SGX
Minimum Enclave Page Cache (EPC) size 256 MB
Intel® SGX (Flat mode only)
Integrated IP Accelerators
Intel® QAT, DLB, IAA, DSA (up to 4 devices each)
Intel® QAT, DLB (up to 2 devices each)
Intel ® DSA, IAA ( 1 device each)
Intel® DSA (4 devices)
Accelerate with Xeon
Visuals: A table with four columns and ten rows. Column 1 is the row label column titled Features. Column 2 is titled 4th Gen Intel® Xeon® Scalable Processors and split into Extreme Core Count (XCC) and Medium Core Count (MCC). Column 3 is titled Intel® Xeon® CPU Max Series, labelled High Bandwidth Memory (HBM). Rows, top to bottom: Die Construction (XCC: 4 tiles connected using MDF over Intel Embedded Multi-die Interconnect Bridge (EMIB); MCC: 1 monolithic chip; HBM: 4 tiles connected using MDF over Intel Embedded Multi-die Interconnect Bridge (EMIB)); Core Count (Up to 60 active cores; Up to 32 active cores; Up to 56 active cores); TDP Range (225 to 350W; 125 to 350W; 350W); Memory (XCC and MCC merged: DDR5 @ 4800 (1 DPC), 4400 (2DPC), 16 Gb DRAM, 8 Channels / Intel® Optane™ PMem 300 (Crow Pass) @4400 MT/s; HBM: DDR5 @ 4800 (1 DPC), 4400 (2DPC), 8Channels / 64 GB HBM2e memory with up to 1.14 GB/core); Intel UPI (UPI 2.0 @ 16 GT/s, up to 4 Ultra Path Interconnects; UPI 2.0 @ 16 GT/s, up to 3 Ultra Path Interconnects; UPI 2.0 @ 16 GT/s, up to 4 Ultra Path Interconnects); Scalability (1 Socket, 2 Socket, 4 Socket, 8 Socket; 1 Socket, 2 Socket, 4 Socket; 1 Socket, 2 Socket); PCIe/Compute Express Link (merged across XCC, MCC and HBM: PCIe 5.0 (80 lanes), / Up to 4 devices supported via Compute Express Link (CXL) 1.1); Security (XCC and MCC merged: Intel® SGX / Minimum Enclave Page Cache (EPC) size 256 MB; HBM: Intel® SGX (Flat mode only)); Integrated IP Accelerators (XCC: Intel® QAT, DLB, IAA, DSA (up to 4 devices each); MCC: Intel® QAT, DLB (up to 2 devices each) / Intel ® DSA, IAA ( 1 device each); HBM: Intel® DSA (4 devices)). Cell borders are thin lines in a muted magenta-violet. Header text is cyan; body text is white. Logo: the intel wordmark in white above XEON in cyan, with a small registered mark. No charts or photographs.
Slide 10
Driving Platform Innovation
Broad Ecosystem Readiness To Deploy Today
DDR5
▪ 8ch DDR5 (per CPU): up to 4800 MT/s
▪ 9x4 RDIMM support
▪ 3DS RDIMM support
▪ New RAS features
▪ Enhanced ECC
▪ Error Check and Scrub
▪ Both 2DPC and 1DPC today
Up to 1.5x
higher memory bandwidth vs. DDR4
PCIe 5.0
▪ 80 lanes
▪ Improved DDIO and QoS capabilities
▪ X2 bifurcation @ Gen 4
Up to 2x
Increased I/O Bandwidth vs. PCIe 4.0
CXL 1.1
▪ Next Gen I/O
▪ Up to 4 CXL devices supported per CPU
▪ Type 1 device: CXL.io and CXL.cache (e.g., SmartNIC)
▪ Type 2 device: CXL.io, CXL.cache and CXL.mem (e.g., GPU, ASIC, FPGA)
Type 1
and Type 2
UPI 2.0
▪ Up to 4 UPI links @ 16 GT/s
▪ New 8S-4 UPI Performance Optimized Topology
Up to 1.9x
Increased inter-socket bandwidth vs. prior gen
intel XEON Accelerate with Xeon
See backup for workloads and configurations. Results may vary.
Visuals: Four rectangular dark panels, one per column: DDR5, PCIe 5.0, CXL 1.1 and UPI 2.0. Each is a near-black navy rectangle with a subtle horizontal gradient darker at the right edge and no visible border. Each panel holds a large cyan heading and a white bulleted list. Below the lists are large periwinkle figures: Up to 1.5x (DDR5), Up to 2x (PCIe 5.0), Type 1 and Type 2 (CXL 1.1, shown as two lines with the word and between), and Up to 1.9x (UPI 2.0), each with a white caption beneath. The figures are numerals and words set as images or large text, with no chart, table or photograph. The Intel XEON logo at bottom-left is a white intel wordmark above a cyan XEON wordmark.
Slide 11
Most Significant 4S/8S Upgrade in 5 Years
Architected for Cloud and Enterprise Customers with Large Scale up Applications
Customers Value 4S+ Systems
1S to 8S Glueless Topologies
Customer Usages
1 Socket
8 Socket
▪ In-Memory DB
▪ Business Intelligence
▪ OLTP
▪ ERP
▪ CRM
▪ Data Warehousing/
Data Mining
▪ Data Visualization
▪ DC Consolidation
Customer Benefits
▪ Advanced RAS for Mission Critical apps
▪ High VM density on a single server node
▪ Reduces Total Cost of Ownership through maximum
consolidation per server
Customer Ecosystem
▪ Over 30 4s/8s server designs and cloud instances
expected in market starting in Q2’23
Highest x86 density of compute / memory in one server
Scale Compute
Performance
Up to
480
cores per server (8S)
Expand Memory
Capacity
Up to
32 TB
memory per server (8S)
Maximize
Multi-Socket BW
8S-4L
new perf opt. topology
(UPI 2.0)
Accelerate with Xeon
Visuals: Two topology diagrams and an Intel Xeon logo. (1) 1 Socket diagram: a rounded light-blue (#BFE3FF) panel at about x 48.9, y 32.4, w 9.1, h 22.0 containing a dark-blue (#003C7A) rectangle labelled EBG with a cream (#FFF2CC) outline at about y 35.1, and a double-headed dark arrow pointing down to a larger dark-blue rectangle labelled S0 with a cream outline at about y 42.0, h 9.8. (2) 8 Socket diagram, first panel: rounded light-blue (#BFE3FF) panel at about x 61.8, y 32.4, w 15.1, h 21.5, with a small dark tag labelled EBG at top-left, eight navy (#003C7A) squares with cream outlines labelled S0, S2, S4, S6 across the top row and S1, S3, S5, S7 across the bottom row (S3 and S5 are the ones at inner positions), connected by thin olive-green (#6B8E23) crossing lines with small black numerals 0 to 3 at line ends; a double-headed link runs along the top between EBG and S6 and along the bottom between S1 and S7. (3) 8 Socket diagram, second panel: identical layout at about x 77.6, y 32.4, w 15.2, h 21.6. Both panels sit on the dark panel background. Intel logo: white lowercase 'intel' wordmark with a registered mark, above cyan (#00C7FD) 'XEON' wordmark, at about x 1.1, y 91.8, w 4.7, h 6.0, followed by the tagline. Nothing is cropped, all diagrams are boxed rather than full-bleed, and no photograph or tint is present.
Slide 12
Maximize the Effectiveness of Every Core / New Integrated IP Acceleration Engines / Increase performance, power and cost / efficiency by enabling offload of common / mode tasks via seamlessly integrated / acceleration engines / Native Dispatch, Signaling, and Synchronization from User / Space / Accelerator Interfacing Architecture / Coherent, Shared Memory Space / Between Cores & Acceleration Engines / Concurrently Shareable / Processes, Containers, & VMs / Utilization Without Acceleration / Core / Core / Core / Core / Utilization With Acceleration / Core / Core / Core / Core / Accel. / Accel. / Intel® IAA, QAT, DLB, DSA / *Integrated / Critical Workloads / Common Mode Tasks / Additional Workload Capacity / intel / XEON / Accelerate with Xeon
Visuals: Two stacked bar-and-core diagrams, not a chart with axes. Top diagram, labelled vertically at left in a dark navy box 'Utilization Without Acceleration': four columns, each a vertical stacked bar (about 4.5% of slide width) sitting on top of a grey Core block. Each bar is a lower grey-to-white gradient segment (Critical Workloads) topped by a blue-to-dark-blue gradient segment (Common Mode Tasks). Column bar heights rise then fall: the first bar's blue top is about 1/3 of the bar, the second bar's grey segment is taller, the third bar's grey segment is lower, and the fourth bar's grey segment reaches about 60% of its height. Thin grey horizontal connector lines run between columns 1 and 2, 2 and 3, and 3 and 4 at mid-height. Below each bar is a square grey metallic Core block (about 4.5% by 8% of slide) with a white inner square labelled 'Core' in dark grey #525252 bold type. Bottom diagram, labelled vertically in a dark navy box 'Utilization With Acceleration': four columns of cyan bars (Additional Workload Capacity, #00C7FD to #0096D6 gradient) on top of grey-to-white Critical Workloads segments, with a thin dark blue line at the cyan/grey junction in columns 2, 3 and 4; column 1 has a larger cyan top, column 2 a short cyan top with a grey segment about 60% tall, column 3 a tall cyan top and small grey base, column 4 a medium cyan top and grey base. Cyan horizontal streak lines run from column 1 to the right edge at about y 57 to 59%, fading to deep blue at the right end. Below the bars are four grey Core blocks labelled 'Core', then two square blue-violet accelerator blocks (#3A4FD6 to #000F8A gradient, light inner squares) labelled 'Accel.' in #000F8A bold type. A curly brace in white hairline sits under the two Accel. blocks with a centred label 'Intel® IAA, QAT, DLB, DSA' and '*Integrated' in italic below it. Legend beneath: a grey-to-white swatch labelled 'Critical Workloads', a blue swatch labelled 'Common Mode Tasks', and a cyan swatch labelled 'Additional Workload Capacity'. Lighting is flat and even with subtle metallic gradients on blocks.
Slide 13
Intel® Accelerator Engines
Most Built-in Accelerators of any CPU on the market providing customers with increased performance,
costs savings and sustainability advantages for the biggest and fastest-growing workloads
Intel® AI
Engines
Intel® Advanced Matrix
Extensions (Intel® AMX)
Intel® Advanced Vector
Extensions 512 (Intel®
AVX-512)
Intel® Deep Learning
Boost (Intel® DL Boost)
Intel®
Security Engines
Intel® Control-Flow
Enforcement Technology
(Intel® CET)
Intel® Crypto Acceleration
Intel® Software Guard
Extensions (Intel® SGX)
Intel® Trust Domain
Extensions (Intel® TDX)
Intel® QuickAssist
Technology (Intel® QAT)
Intel® HPC
Engines
Intel® Advanced Vector
Extensions 512 (Intel®
AVX-512)
Intel® Advanced Matrix
Extensions (Intel® AMX)
Intel® Data Streaming
Accelerator (Intel® DSA)
Intel® QuickAssist
Technology (Intel® QAT)
Intel®
Network Engines
Intel® QuickAssist
Technology (Intel® QAT)
Intel® Dynamic Load
Balancer (Intel® DLB)
Intel® Data Streaming
Accelerator (Intel® DSA)
Intel® Advanced Vector
Extensions (Intel® AVX)
for vRAN
Intel® Speed Select
Technology (Intel® SST)
Intel®
Analytics Engines
Intel® In-memory
Analytics Accelerator
(Intel® IAA)
Intel® Data Streaming
Accelerator (Intel® DSA)
Intel® Advanced Vector
Extensions 512 (Intel®
AVX-512)
Intel® QuickAssist
Technology (Intel® QAT)
Intel®
Storage Engines
Intel® Data Streaming
Accelerator (Intel® DSA)
Intel® QuickAssist
Technology (Intel® QAT)
Intel® In-memory Analytics
Accelerator (Intel® IAA)
Intel® Data Direct I/O
(Intel® DDIO)
Intel® Advanced Vector
Extensions 512 (Intel® AVX-512)
Intel® Crypto Acceleration
intel
XEON
Accelerate with Xeon
Supported in 4th Gen Intel® Xeon® Scalable processors
and Intel® Xeon® CPU Max Series processors
Visuals: Six white line icons sit to the right of the column headings inside the panel: a robot with antenna (AI Engines, about x14.5 y30.2 w2.3 h5.6%), a padlock (Security Engines, about x25.5 y29.6 w1.9 h4.2%), a stacked server rack (HPC Engines, about x44.5 y30.8 w2.1 h4.0%), a hub with three connected nodes (Network Engines, about x54.2 y29.8 w2.8 h4.5%), a bar chart with a gear/spark (Analytics Engines, about x70.4 y30.4 w2.2 h3.8%), and a cylinder database (Storage Engines, about x85.1 y30.0 w2.2 h4.9%). All icons are white, flat, and unboxed. The panel is a dark navy translucent rectangle with a thin pale-blue border, and the five cyan vertical divider lines (about 0.3% wide, 50.2% tall, starting at 30.7%) sit at x 18.6, 33.9, 47.7, 63.2 and 79.2%. No photographs or charts.
Slide 14
Intel Offers the Most Built-in Accelerators
4th Gen Intel® Xeon® Scalable Processors
4th Gen AMD EPYC (Genoa)
Intel® Advanced Vector Extensions 512 (Intel® AVX-512)
Supported since 2015
New in 2022 – AVX 512
Intel® Crypto Acceleration
Supported since 2021
New in 2022 – Crypto NI
VNNI, BF16 (Intel® Deep Learning Boost)
Supported since 2019
New in 2022 – VNNI, BF16
Intel® Advanced Vector Extensions (Intel® AVX) for vRAN
Intel® Advanced Matrix Extensions (Intel® AMX)
Intel® Control-Flow Enforcement Technology (Intel® CET)
Shadow Stack
Intel® Software Guard Extensions (Intel® SGX)
Supported since 2021
Intel® Trust Domain Extensions (Intel® TDX)
Targeted CSP availability
SEV-SNP
Intel® Speed Select Technology (Intel® SST)
Supported since 2019
Intel® Data Direct I/O Technology (Intel® DDIO)
Supported since 2015
Intel® Dynamic Load Balancer (Intel® DLB)
Intel® QuickAssist Technology (Intel® QAT) (integrated)
Intel® Data Streaming Accelerator (Intel® DSA)
Intel® In-Memory Analytics Accelerator (Intel® IAA)
Accelerate with Xeon
Visuals: Table with 3 columns and a header row, followed by 14 feature rows. Header cells: (blank feature column), '4th Gen Intel® Xeon® Scalable Processors' (centred over column 2), '4th Gen AMD EPYC (Genoa)' (centred over column 3). Rows, columns 1 / 2 / 3: (1) Intel® Advanced Vector Extensions 512 (Intel® AVX-512) / Supported since 2015 (cyan) / New in 2022 – AVX 512. (2) Intel® Crypto Acceleration / Supported since 2021 / New in 2022 – Crypto NI. (3) VNNI, BF16 (Intel® Deep Learning Boost) / Supported since 2019 / New in 2022 – VNNI, BF16. (4) Intel® Advanced Vector Extensions (Intel® AVX) for vRAN / cyan checkmark / blank. (5) Intel® Advanced Matrix Extensions (Intel® AMX) / cyan checkmark / blank. (6) Intel® Control-Flow Enforcement Technology (Intel® CET) / cyan checkmark / Shadow Stack. (7) Intel® Software Guard Extensions (Intel® SGX) / Supported since 2021 / blank. (8) Intel® Trust Domain Extensions (Intel® TDX) / cyan checkmark with italic note 'Targeted CSP availability' / SEV-SNP. (9) Intel® Speed Select Technology (Intel® SST) / Supported since 2019 / blank. (10) Intel® Data Direct I/O Technology (Intel® DDIO) / Supported since 2015 / blank. (11) Intel® Dynamic Load Balancer (Intel® DLB) / cyan checkmark / blank. (12) Intel® QuickAssist Technology (Intel® QAT) (integrated) / cyan checkmark / blank. (13) Intel® Data Streaming Accelerator (Intel® DSA) / cyan checkmark / blank. (14) Intel® In-Memory Analytics Accelerator (Intel® IAA) / cyan checkmark / blank. Cyan checkmarks are flat, stroked check glyphs about 1.8% wide, centred on column 2. Eight rows carry a translucent purple band (#8F5DA2 at 20% opacity) spanning the full table width. No chart, photograph or illustration.
Slide 15
A Higher Performance Server Architecture
Benefits of Intel® Accelerator Engines
Intel® Advanced
Matrix Extensions
(Intel® AMX)
Up to
8.6x
higher speech recognition
inference performance
with built-in AMX BF16 vs.
FP32
Intel® Dynamic
Load Balancer
(Intel® DLB)
Up to
96%
lower latency
at the same throughput for
Istio-Envoy Ingress with Intel®
DLB vs. software for Istio
Ingress gateway
Intel® Data
Streaming
Accelerator
(Intel® DSA)
Up to
1.7x
higher IOPs for SPDK-
NVMe with built-in Intel®
DSA vs. ISA-L software
Intel® In-Memory
Analytics
Accelerator
(Intel® IAA)
Up to
2.1x
higher RocksDB
performance with Intel® IAA
vs Ztsd software
Intel® QuickAssist
Technology
(Intel® QAT)
Up to
84%
fewer cores to achieve
same connections/s on
NGINX with built-in QAT
vs. out-of-box software
Accelerators Enable Step Function Performance Beyond Base Architecture
intel
XEON
Accelerate with Xeon
See backup for workloads and configurations. Results may vary.
Visuals: Five identical dark rounded-rectangle-free rectangular cards, each with a title, a centered 'Up to' line, a large stat in lilac, and a short description. Card 1: 'Intel® Advanced Matrix Extensions (Intel® AMX)', 8.6x, higher speech recognition inference performance with built-in AMX BF16 vs. FP32. Card 2: 'Intel® Dynamic Load Balancer (Intel® DLB)', 96%, lower latency at the same throughput for Istio-Envoy Ingress with Intel® DLB vs. software for Istio Ingress gateway. Card 3: 'Intel® Data Streaming Accelerator (Intel® DSA)', 1.7x, higher IOPs for SPDK-NVMe with built-in Intel® DSA vs. ISA-L software. Card 4: 'Intel® In-Memory Analytics Accelerator (Intel® IAA)', 2.1x, higher RocksDB performance with Intel® IAA vs Ztsd software. Card 5: 'Intel® QuickAssist Technology (Intel® QAT)', 84%, fewer cores to achieve same connections/s on NGINX with built-in QAT vs. out-of-box software. No photographs or charts. Each card has a faint soft drop shadow and a subtle blue glow beneath it that reaches into the banner area. The banner is a thin translucent dark-navy bar with a slightly lighter top edge. The Intel logo is white lettering with a registered mark, the XEON wordmark is cyan, and the tagline is white.
Slide 16
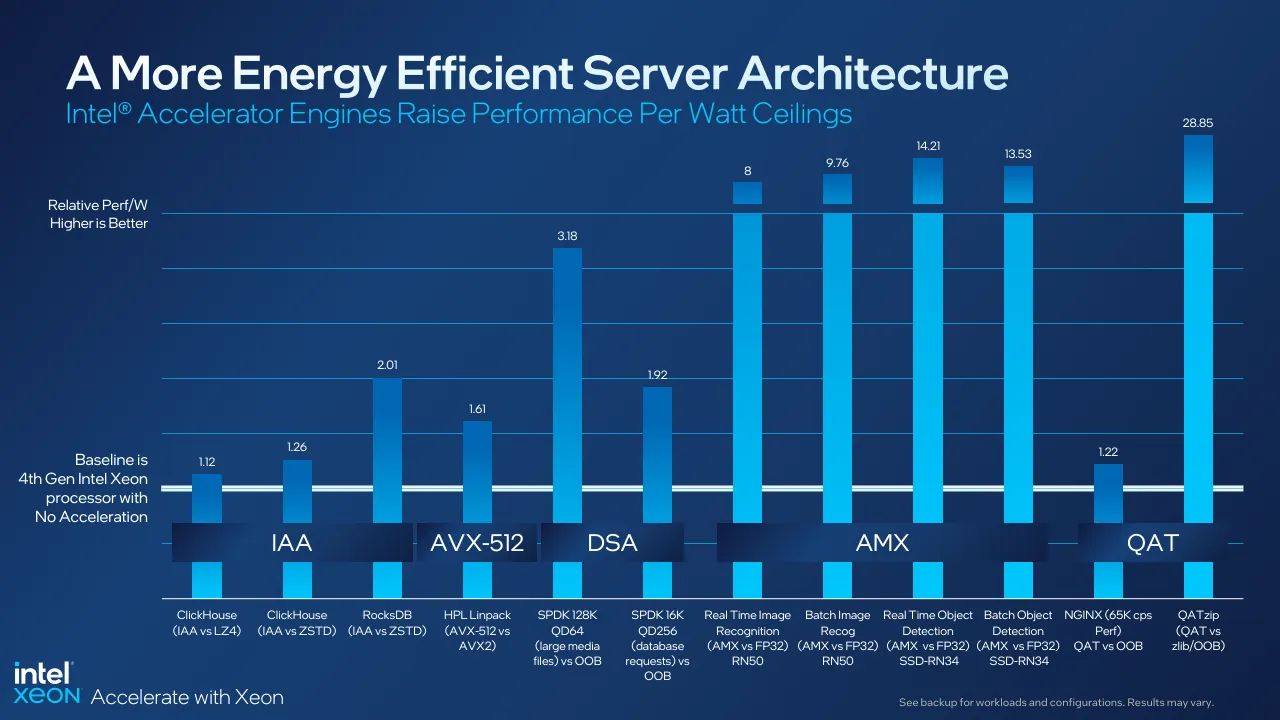
A More Energy Efficient Server Architecture
Intel® Accelerator Engines Raise Performance Per Watt Ceilings
Relative Perf/W
Higher is Better
Baseline is
4th Gen Intel Xeon
processor with
No Acceleration
1.12
1.26
2.01
1.61
3.18
1.92
8
9.76
14.21
13.53
1.22
28.85
IAA
AVX-512
DSA
AMX
QAT
ClickHouse
(IAA vs LZ4)
ClickHouse
(IAA vs ZSTD)
RocksDB
(IAA vs ZSTD)
HPL Linpack
(AVX-512 vs
AVX2)
SPDK 128K
QD64
(large media
files) vs OOB
SPDK 16K
QD256
(database
requests) vs
OOB
Real Time Image
Recognition
(AMX vs FP32)
RN50
Batch Image
Recog
(AMX vs FP32)
RN50
Real Time Object
Detection
(AMX vs FP32)
SSD-RN34
Batch Object
Detection
(AMX vs FP32)
SSD-RN34
NGINX (65K cps
Perf)
QAT vs OOB
QATzip
(QAT vs
zlib/OOB)
Accelerate with Xeon
See backup for workloads and configurations. Results may vary.
Visuals: Vertical bar chart of 12 bars, each labelled with its value and category, grouped into five bands. Bars are blue gradient (darker blue #0060B0 at the top, brightening to cyan #00C7FD toward the bottom) with bright cyan #00C7FD lower segments where they pass behind the group bands. Values, left to right: 1.12 (ClickHouse, IAA vs LZ4); 1.26 (ClickHouse, IAA vs ZSTD); 2.01 (RocksDB, IAA vs ZSTD); 1.61 (HPL Linpack, AVX-512 vs AVX2); 3.18 (SPDK 128K QD64 large media files vs OOB); 1.92 (SPDK 16K QD256 database requests vs OOB); 8 (Real Time Image Recognition, AMX vs FP32, RN50); 9.76 (Batch Image Recog, AMX vs FP32, RN50); 14.21 (Real Time Object Detection, AMX vs FP32, SSD-RN34); 13.53 (Batch Object Detection, AMX vs FP32, SSD-RN34); 1.22 (NGINX 65K cps Perf, QAT vs OOB); 28.85 (QATzip, QAT vs zlib/OOB). Axis: no numeric scale is printed; the vertical axis is described only as Relative Perf/W, Higher is Better, with the horizontal white reference line labelled Baseline is 4th Gen Intel Xeon processor with No Acceleration at 67.9% of the height (value 1.0). Seven thin horizontal gridlines in #3A78B8 at roughly 29.6%, 37.2%, 44.9%, 52.5%, 60.2%, 67.9% and 75.5% of the height; the category axis line is light grey-white at 83.1%. Group bands are dark translucent navy rectangles with white text, drawn over the bar bases. No legend; no bars are highlighted.
Slide 17
Built for More Sustainable Operations
Energy Efficiency (Java Perf/W)
800
700
600
500
400
300
200
100
0
421
487
545
594
653
693
697
697
696
697
698
274
344
406
466
514
640
678
Low to Intermediate
CPU utilization
(below ~40%)
Medium
CPU utilization
High/Peak
CPU utilization
Power (W)
0
2,000,000
4,000,000
6,000,000
8,000,000
10,000,000
12,000,000
Server-Side Java Performance
Out of Box
Optimized Power Mode
Optimized Power Mode
Saves up to 20% CPU power at less than
5% performance impact for selected
workloads
Saves power where customers tend to
run (~30-40% utilization)
▪ up to 70W per socket at low utilization
Easy button BIOS option to enable (CSP,
OxM, End User)
Accelerate with Xeon
See backup for workloads and configurations. Results may vary.
Visuals: Line chart titled 'Energy Efficiency (Java Perf/W)' with two series plotted against Server-Side Java Performance. X axis: 0 to 12,000,000 with labelled ticks every 2,000,000. Y axis: 'Power (W)' from 0 to 800 with ticks every 100. Series 'Out of Box' (blue, about #4A6FD0, circle markers) labelled values: 421 at 0, 487 at about 1.2M, 545 at about 2.3M, 594 at about 3.4M, 653 at about 4.5M, 693 at about 5.7M, 697 at about 6.8M, 697 at about 8.0M, 696 at about 9.2M, 697 at about 10.3M, 698 at about 11.4M. Series 'Optimized Power Mode' (green, about #1DB233, circle markers) labelled values: 274 at 0, 344 at about 1.2M, 406 at about 2.3M, 466 at about 3.4M, 514 at about 4.5M, 640 at about 5.7M (with a short leader line), 678 at about 6.8M, and about 697 at 8.0M, about 696 at 9.2M, about 697 at 10.3M, about 698 at 11.4M where the two series converge. Legend at bottom centre: blue line with dot 'Out of Box', green line with dot 'Optimized Power Mode'. Highlighted: two vertical translucent blue bands (about #1F5FA8) at about 4.5M and 8.0M on the x axis, dividing the plot into three shaded zones, each with a labelled dark callout box: 'Low to Intermediate / CPU utilization (below ~40%)' over 0 to about 4.5M, 'Medium / CPU utilization' over about 4.5M to 8.0M, and 'High/Peak / CPU utilization' over 8.0M to 12M. Chart box has a thin white outline and no fill beyond the dark plot. No photographs or other illustrations.
Slide 18
Delivering Leading Performance for
Customer Workloads
Artificial Intelligence
Intelligence
Networking
5G
Storage
HPC
Data
Analytics
Intel XEON
Accelerate with Xeon
Visuals: Five photographs in a row, each in a boxed rectangle, none full-bleed, all the same size (about 17.0% wide by 26.0% tall). 1) Artificial Intelligence: extreme close-up of a face with the edge of a dark-framed pair of glasses; the lens reflects blue and green lines of computer code; pink skin tones on the right, dark blue-black on the left; shallow depth of field; tight framing. 2) Networking 5G: aerial view of a city at dusk under an orange-to-violet sunset sky; a glowing blue lattice of lines with bright white nodes spreads across the city lights, which are warm orange and white; wide framing. 3) Storage: a man in a green knit sweater and glasses holds a laptop and touches a dark server rack in a dark data-centre aisle; lit by a white strip light at the top and purple light at the right edge; medium framing, subject on the right. 4) HPC: rear view of a man with short blond hair in a grey hoodie facing several monitors showing data grids and charts; a second person with dark hair is partly visible at the upper left; blue-tinted monitor light; medium framing. 5) Data Analytics: a man in a light blue shirt at a desk with his hands on a keyboard, facing a monitor showing code; a second monitor on the right shows a glowing blue 3D point-cloud cube; server racks blurred behind; medium-wide framing. Below each photo the panel is a dark navy gradient, and beneath the cards are faded reflections of the photos. The XEON logo is a white bold 'intel' wordmark over cyan 'XEON' letters.
Slide 19
Architecting to Accelerate Customer Workloads / Leading Performance with most built-in accelerators / 4th Gen Intel® Xeon® Scalable processors / Intel® Xeon® / CPU Max Series / General / Purpose / Compute / 53% / average / performance / gain* / Artificial / Intelligence / Up to 10x / higher / inference and / training / performance* / Network 5G / vRAN / Up to 2x / capacity for / vRAN workloads / at same power / envelope* / Networking / & Storage / Up to 2x / higher data / compression / with 95% fewer / cores* / Data Analytics / Up to 3x / higher / performance* / HPC / Up to 3.7x / on memory- / bound / workloads** / Performance / per Watt / 2.9x / average improvement with / built-in accelerators* / *4th Gen Intel® Xeon® Scalable Processor vs. 3rd Gen Intel Xeon Scalable processors. / ** Intel Xeon CPU Max Series vs. / Intel Xeon 8380 processor. / intel XEON / Accelerate with Xeon / See backup for workloads and configurations. Results may vary.
Visuals: No charts, tables or photographs. Six dark rectangular tiles arranged as columns: General Purpose Compute (tall, x 5.3 to 19.6, y 29.4 to 88.1), Artificial Intelligence (x 20.4, y 29.4 to 73.7), Network 5G vRAN (x 35.6, y 29.4 to 73.7), Networking and Storage (x 50.7, y 29.4 to 73.5), Data Analytics (x 65.8, y 29.4 to 73.7), HPC (tall, x 80.7 to 95.0, y 29.4 to 88.1). Each tile shows a light blue category label, a large light blue stat and white descriptive text, with a soft shadow at the bottom edge. Header bar is a thin light blue outlined rectangle. Intel XEON logo (white 'intel' above light blue 'XEON' with registered mark) at bottom-left. Dark navy-black fill bar (#0D1C33) behind the Performance per Watt row. No other icons.
Slide 20
4th Gen Intel® Xeon® Scalable Processors
Significant Performance Across Broad Workloads
2S 4th Gen Intel Xeon Scalable Platform vs. Prior Generation
Higher is better
Database
HPC
Web
Media
Network
AI
2.93
4.86
4.00
5.46
10.02
2.58
2.55
2.00
2.02
2.03
1.88
1.80
1.77
1.75
1.74
1.73
1.68
1.65
1.64
1.61
1.58
1.57
1.54
1.52
1.50
1.47
1.88
8380 =1.0
Normalized to 2S 3rd Gen Intel Xeon Scalable platform
OLTP - HammerDB MySQL
NoSQL - Cassandra mix throughput
RocksDB
FSI - Binomial Options
Manufacturing - ESI Group OpenFOAM
Life/Material Science - LAMMPS
Earth System Model - ROMS
Wordpress TLS 1.3
Server-Side Java max
DeathStarBench - Hotel Reservation
DeathStarBench - Social Network
AVC-1080p-fast-avx2 (x264)
x265-4k-veryslow-avx2
SVT-HEVC-4k-preset1-avx3
NGINX TLS 1.3 Webserver AES128-GCM-SHA256
CDN Video-on-Demand [Varnish Plus]
CDN Live [NGINX]
FIB
FlexRAN
vCMTS
IPSEC
E2E Face Recognition
BERT (RT inference)
SSD-RN34 (RT inference)
Training BERT
Training SSD-RN34
SSD-RN34 (RT Inference BF16)
See backup for workloads and configurations. Results may vary.
This offering is not approved or endorsed by OpenCFD Limited, producer and distributor of the OpenFOAM
software via www.openfoam.com, and owner of the OPENFOAM® and OpenCFD® trademark.
Intel
XEON
Accelerate with Xeon
Visuals: Vertical bar chart titled '2S 4th Gen Intel Xeon Scalable Platform vs. Prior Generation' with subtitle 'Higher is better'. Y-axis title 'Normalized to 2S 3rd Gen Intel Xeon Scalable platform' (unitless ratio, baseline labelled '8380 =1.0' at the red reference line; no numeric axis ticks, gridlines unlabelled, range about 0 to 10.5). Bars are grouped by workload with dark translucent panels and white group labels: Database (bars 1-3), HPC (4-6), Web (7-11), Media (12-14), Network (15-21), AI (22-27). Each bar has a gradient fill in its group colour (Database cyan/blue, HPC blue, Web gold/yellow, Media light blue, Network mauve/pink, AI violet/indigo) and a white value label above it. Values in order: OLTP - HammerDB MySQL 1.50; NoSQL - Cassandra mix throughput 1.73; RocksDB 2.93; FSI - Binomial Options 1.58; Manufacturing - ESI Group OpenFOAM 1.64; Life/Material Science - LAMMPS 1.68; Earth System Model - ROMS 1.77; Wordpress TLS 1.3 1.47; Server-Side Java max 1.57; DeathStarBench - Hotel Reservation 1.61; DeathStarBench - Social Network 1.88; AVC-1080p-fast-avx2 (x264) 1.54; x265-4k-veryslow-avx2 1.65; SVT-HEVC-4k-preset1-avx3 1.75; NGINX TLS 1.3 Webserver AES128-GCM-SHA256 1.52; CDN Video-on-Demand [Varnish Plus] 1.80; CDN Live [NGINX] 1.74; FIB 1.88; FlexRAN 2.00; vCMTS 2.02; IPSEC 2.03; E2E Face Recognition 2.55; BERT (RT inference) 2.58; SSD-RN34 (RT inference) 4.86; Training BERT 4.00; Training SSD-RN34 5.46; SSD-RN34 (RT Inference BF16) 10.02. The four tallest bars (SSD-RN34 RT inference 4.86, Training BERT 4.00, Training SSD-RN34 5.46, SSD-RN34 RT Inference BF16 10.02) are capped with lighter lavender tops. A red horizontal reference line at the 1.0 level (8380 =1.0) runs across the full plot width, with a thin white-grey baseline under the bars. No legend; no highlighted points beyond the red line and the lighter caps.
Slide 21
Improving Performance When Response Time Matters
4th Gen Intel® Xeon® Scalable processors
Usages/Workload
Benchmark
Service Level Agreement (SLA)
Requirement
Performance Gain*
Web Microservices
CloudXPRT
P95 latency < = 3sec
1.5x
Java Application Performance
Server-Side Java
(Critical JOPs)
Geomean of 10ms, 25ms, 50 ms, 75ms
and 100ms response times
1.6x
Cassandra Database
Cassandra Stress
P99 latency of <=20 ms
1.7x
Microservices – Social Networking
DeathStarBench
100 ms max SLA
1.8x
Image Classification (Real-time)
Resnet50 v1.5
15 ms max
3.0x
Object Detection (Real-time)
SSD-RN34
100 ms max
4.8x
Accelerate with Xeon
*4th Gen Intel Xeon vs. previous gen.
See backup for workloads and configurations. Results may vary.
Visuals: None apart from the Intel Xeon logo at bottom left (intel wordmark in white over XEON in cyan #00C7FD) and the table's alternating shaded row bands (a 20 percent opacity #8F5DA2 tint on rows 1, 3 and 5, shown per column). The table has four columns and six data rows: Web Microservices / CloudXPRT / P95 latency < = 3sec / 1.5x; Java Application Performance / Server-Side Java (Critical JOPs) / Geomean of 10ms, 25ms, 50 ms, 75ms and 100ms response times / 1.6x; Cassandra Database / Cassandra Stress / P99 latency of <=20 ms / 1.7x; Microservices – Social Networking / DeathStarBench / 100 ms max SLA / 1.8x; Image Classification (Real-time) / Resnet50 v1.5 / 15 ms max / 3.0x; Object Detection (Real-time) / SSD-RN34 / 100 ms max / 4.8x.
Slide 22
A More Cost-Efficient Server Architecture
Benefits of Workload Optimized Products
When considering new purchases for the data center, deploy fewer 4th Gen Intel® Xeon® processor-based / servers or Intel® Xeon® CPU Max processor-based servers to meet the same performance requirement
Comparisons to deploying / 50 servers with 3rd Gen Intel Xeon processor
Artificial Intelligence
(Real time Inferencing, / RSN50 w/ Intel® AMX)
Database
(Rocks DB w/Intel® IAA)
HPC
(OpenFOAM)
Number of Intel Xeon processor- / based servers
17 servers
with 4th Gen Intel® Xeon processors
18 servers
with 4th Gen Intel® Xeon processors
16 servers
with Intel® Xeon® CPU Max Series
Lower Fleet Power (kilowatts)
22.1 kW
15.4 kW
25.7 kW
Reduced CO2 emissions (kg)*
524,000 kg
366,000 kg
611,000 kg
TCO savings ($)*
$1.3M
$1.2M
$1.5M
55% Lower TCO
52% Lower TCO
66% Lower TCO
* Estimated over 4 years
See backup for workloads and configurations. Results may vary.
This offering is not approved or endorsed by OpenCFD / Limited, producer and distributor of the OpenFOAM / software via www.openfoam.com, and owner of the / OPENFOAM® and OpenCFD® trademark
Accelerate with Xeon
Visuals: One data table, no photographs, charts or icons. Columns: (1) row labels, (2) Artificial Intelligence (Real time Inferencing, RSN50 w/ Intel® AMX), (3) Database (Rocks DB w/Intel® IAA), (4) HPC (OpenFOAM). Rows: (a) Number of Intel Xeon processor-based servers: 17 servers with 4th Gen Intel® Xeon processors | 18 servers with 4th Gen Intel® Xeon processors | 16 servers with Intel® Xeon® CPU Max Series. (b) Lower Fleet Power (kilowatts): 22.1 kW | 15.4 kW | 25.7 kW. (c) Reduced CO2 emissions (kg)*: 524,000 kg | 366,000 kg | 611,000 kg. (d) TCO savings ($)*: $1.3M | $1.2M | $1.5M. (e) Green savings line, no row label: 55% Lower TCO | 52% Lower TCO | 66% Lower TCO. Row (a) and row (c) cells sit on a translucent purple-tinted band, row (b) and row (d) on the plain navy band. Row label column text is cyan, data values white, savings line green.
Slide 23
4th Gen Intel® Xeon® Scalable Processors / for HPC Accelerated Performance / • Built-in acceleration to boost application / performance – Intel AVX 512, Intel DSA, Intel AMX / • New µarch, built on Intel 7, with up to 60 / performance cores for added compute / • Increased memory bandwidth and higher speeds / with DDR5 / • Higher IO bandwidth with PCIe 5. and support for / coherent interface with CXL 1.1 / Intel Advanced Vector / Extensions 512 (AVX-512) / Intel Advanced / Matrix Extensions (AMX) / Intel Data Streaming / Accelerator (DSA) / Accelerate with Xeon
Visuals: Photograph of a 4th Gen Intel Xeon Scalable processor package: a dark black rectangular substrate seen at an oblique three-quarter angle, rotated so its long edge runs from lower-left to upper-right, with four gold-tinted heat-spreader tiles (chiplets) in a 2x2 arrangement at its centre and pin/contact edges visible along the sides. It is lit from above with a soft shadow falling beneath it to the lower left, shown on a blue-to-purple gradient background; the image is boxed (not full-bleed) inside the left panel, with the product cut out from its background. Dominant colours: black, gold, violet #6A3FB5, blue #2F6FD0, cyan #4FC8E8. A small Intel XEON logo box sits in the top-left corner of the photo panel (intel wordmark over XEON wordmark on a dark blue #1B4F9C square, with lighter blue vertical bands). Three white line icons sit in the icon strip: a chip with a vector/circuit-like cut-out outline (AVX-512); a chip with a centred 'Ai' glyph in a box (AMX); a stacked server/streaming-storage icon with a dot (DSA). Bullets are small white solid dots. The lower-right panel is an empty decorative gradient bar from dark indigo #2A2A7A at the top edge to blue #2E5FB0 and teal #3A8FC0 at the bottom right, with a thin lighter band along its top.
Slide 24
Up to / 2.6x / Performance / On Real Workloads / 2S 4th Gen Intel® Xeon® processor vs. / 2S 3rd Gen Intel® Xeon® 8380 processor / Relative Perf. Higher is better / Earth Systems / Modeling / Energy / Financial / Services / Life and Material / Science / Manufacturing / Physics / 3 / 2.5 / 2 / 1.5 / 1 / 0.5 / 0 / 1.0 / 1.7 / 1.7 / 1.8 / 1.6 / 1.6 / 1.7 / 1.6 / 1.6 / 1.4 / 1.4 / 1.5 / 1.5 / 1.7 / 1.4 / 1.6 / 1.4 / 1.3 / 1.6 / 1.4 / 1.4 / 1.6 / 1.6 / 1.4 / 1.5 / 2.6 / Intel® Xeon® 8380 / MPAS-A / NEMO / ROMS / WRF / Anelastic Wave Propagation / ISO3DFD / Standard Staggered Grid / Binomial Options / Black Scholes / Monte Carlo / DeepMD Training / GROMACS / LAMMPS / Quantum Espresso / VASP / Altair AcuSolve / Altair RADIOSS / Ansys Fluent / Ansys LS-DYNA / Ansys Mechanical / CONVE, RGE / OpenFOAM / ParSeNet / Siemens Simcenter Star-CCM+ / Cosmoflow / Accelerate with Xeon / See backup for workloads and configurations. Results may vary. / This offering is not approved or endorsed by OpenCFD Limited, producer and distributor of the OpenFOAM software via www.openfoam.com, and owner of the OPENFOAM® and OpenCFD® trademark / MLPerf™ HPC-AI v0.7 Training benchmark Performance. Result not verified by MLCommons Association. Unverified results have not been through an MLPerf™ review and may use measurement methodologies and/or / workload implementations that are inconsistent with the MLPerf™ specification for verified results. The MLPerf™ name and logo are trademarks of MLCommons Association in the United States and other countries. All / rights reserved. Unauthorized use strictly prohibited. See www.mlcommons.org for more information
Visuals: Vertical bar chart titled Relative Perf. Higher is better (no units; y-axis is relative performance, linear, range 0 to about 3.3, gridlines and tick labels at 0, 0.5, 1, 1.5, 2, 2.5, 3; faint dotted horizontal gridlines). X-axis: 26 categories, rotated 45 degrees labels. Series: single series of bars with printed value labels above each bar. Printed values in order: Intel Xeon 8380 1.0 (baseline bar, violet-blue); MPAS-A 1.7; NEMO 1.7; ROMS 1.8; WRF 1.6; Anelastic Wave Propagation 1.6; ISO3DFD 1.7; Standard Staggered Grid 1.6; Binomial Options 1.6; Black Scholes 1.4; Monte Carlo 1.4; DeepMD Training 1.5; GROMACS 1.5; LAMMPS 1.7; Quantum Espresso 1.4; VASP 1.6; Altair AcuSolve 1.4; Altair RADIOSS 1.3; Ansys Fluent 1.6; Ansys LS-DYNA 1.4; Ansys Mechanical 1.4; CONVE, RGE 1.6; OpenFOAM 1.6; ParSeNet 1.4; Siemens Simcenter Star-CCM+ 1.5; Cosmoflow 2.6 (the tallest bar, highest point, no highlight colour beyond the bar itself). Groups: Earth Systems Modeling (MPAS-A, NEMO, ROMS), Energy (WRF, Anelastic Wave Propagation, ISO3DFD), Financial Services (Standard Staggered Grid, Binomial Options, Black Scholes), Life and Material Science (Monte Carlo, DeepMD Training, GROMACS, LAMMPS, Quantum Espresso), Manufacturing (VASP, Altair AcuSolve, Altair RADIOSS, Ansys Fluent, Ansys LS-DYNA, Ansys Mechanical, CONVE, RGE, OpenFOAM, ParSeNet, Siemens Simcenter Star-CCM+), Physics (Cosmoflow). A horizontal reference line at 1.0 in grey-violet crosses all bars. No legend. Highlighted points: the Intel Xeon 8380 baseline bar is the only bar in a different colour (violet-blue #5B6CFF). Intel XEON badge logo at top-left, Intel XEON wordmark logo at bottom-left, and a small Intel logo at bottom-left above XEON.
Slide 25
INTRODUCING
Intel® Xeon® CPU Max Series
Designed for HPC, AI, Analytics and other memory bound Workloads
1st x86 CPU to integrate high bandwidth memory and accelerators onto the processor package
Improved TCO with reduced DDR dependency
Accelerate with Xeon
Visuals: Product image: a square boxed render of an Intel Xeon CPU Max Series package, placed at about x72.2 y31.5 w20.4 h36.2 (percent of slide). Within it, the white lowercase intel wordmark with registered mark sits at top left, a large silver-to-white XEON wordmark with registered mark sits in the middle, and a blue band labelled MAX SERIES in white capitals sits at the bottom left. The background of the render is black fading to deep blue with a diagonal light sheen. A vertical blue-grey side strip runs along the right edge of the render. The render is not cropped and is boxed, with a faint blue glow behind it. Small logo tile: a square blue-gradient tile at about x86.5 y70.8 w7.7 h13.7 showing the white intel wordmark above the cyan XEON wordmark. Bottom-left logo: the white intel wordmark above the cyan XEON wordmark, at about x1.0 y91.6 w21.2 h6.7. Decorative lines: cyan (#00C7FD) hairline brackets. One runs vertically at x5.2 from y22.6 to y77.3 with a short horizontal stub at its top from x5.2 to x13. A second runs at the upper right, horizontal from x83.2 to x90.4 at y25, then vertical down at x90.4 from y25 to y76.5. A horizontal cyan line runs at y80 from x5.2 to about x89.7, fading to transparent toward the right.
Slides 26 to 69 continue in the full text file.
Download this deck
The hosted PDF of every library deck is free for readers of the SlideDeck Co newsletter. Join with your email and the viewer and download appear here.
Writing a sales deck of your own? The SlideDeck Co Sales Deck is a slide library with a priced services proposal and a Word statement of work.