The deck opens with a title slide and a team slide introducing the CEO and CTO, both MIT-educated engineers with prior startup and big-tech experience. It then argues the problem: companies must measure user behaviour to improve products, and retention drives growth. Next it positions analytics as core infrastructure, using a Facebook retention study as an example of behavioural cohorting. The solution section describes Amplitude as a powerful analytics product for app teams, covering cohorting, raw data access and pricing at scale. Technical advantages follow, focusing on a claimed 20X data-volume advantage and deeper query capability. Market sizing uses Gartner and Redwood Capital figures on business intelligence and mobile analytics growth. A competitive landscape compares Amplitude with named analytics and mobile marketing tools. Traction, distribution through an enterprise sales process, and long-term advantages close the deck. Slides worth studying include the cohort-definition example on slide 6, the competitive landscape map on slide 14, and the single-claim tech advantage slide on slide 10.
Full text of the slides (18 slides)
Every slide's words and a description of its charts and images, so the deck can be searched and rebuilt. Also available as Markdown.
Slide 1
A / AMPLITUDE / powerful analytics at scale
Visuals: Logo: a white stylised letter A drawn as a thin, even-weight monoline, with a horizontal crossbar that extends right past the strokes, and a sine-wave tail that rises from the crossbar and dips below it at the right, forming a single amplitude-curve motif. It sits centred above the wordmark. Background: a subtle low-poly faceted pattern of slightly darker and lighter blue triangles radiating from the centre. No photographs, charts or other graphics.
Slide 2
TEAM / Spenser Skates, CEO / - high-frequency trader @ DRW / - B.S. Biological Engineering, MIT / 2010 / Curtis Liu, CTO / - software engineer @ Google / - previous: EA / - B.S. Electrical Engineering & / Computer Science, / Mathematics, MIT 2010 / Sonalight text-by-voice (YC W12) / Won MIT's largest programming / competition / Spenser & Curtis / pre-Amplitude / All-star team highlights: experience @ Palantir, Sumo Logic, Google, Microsoft; / Stanford ACM team; Putnam; Stanford PhD dropouts; https://amplitude.com/about / 2
Visuals: Two circular portrait photographs. Left: Spenser Skates, a smiling young man with short dark wavy hair, white collared shirt and green jacket collar, head and shoulders, centred in a circle about 21 percent of slide width, warm brownish-green background, soft even indoor lighting, full-face framing, circle crop with no border. Right: Curtis Liu, a smiling young man with short black hair and thin dark-rimmed glasses, light grey-blue checked button-up shirt, head and shoulders, centred in a circle, plain grey vertical-panel background, soft even lighting, circle crop with no border. Also one teal filled rectangle callout behind the Sonalight text, with a soft drop shadow, and one orange (#E8741E) left-pointing arrow with a line shaft running from the right-hand annotation to the callout box edge. No charts, tables or logos.
Slide 3
YOU MAKE WHAT YOU MEASURE To know where you're at as a company... You need to measure it first To improve your product... You need to know where your users are having problems You need to know what changes you can make that will improve your product To make product decisions, you need user data Why is this so important? The KEY to growth is retaining users 3
Visuals: Five chevron (arrow-pointing) shapes in two staggered rows, plus one dark blue text bar. Row 1: a light sky-blue chevron (about #7FCFF5) labelled 'To know where you're at as a company...' followed by a very pale blue chevron (about #DDEEFA) labelled 'You need to measure it first'. Row 2: a saturated dark blue chevron (about #1A5CB5) labelled 'To improve your product...', followed by a pale grey-blue chevron (about #DCE3F2) labelled 'You need to know where your users are having problems', and a light grey chevron (about #D8DAE6) labelled 'You need to know what changes you can make that will improve your product'. Each secondary chevron overlaps the one before it with a thin white gap. The chevron arrows point right; the notch on the left of each chevron is a white V. No photographs, icons or charts. The dark blue rectangle (about #1B4FA0) holds 'The KEY to growth is retaining users' with the words 'retaining users' in yellow-green (about #D4E83A).
Slide 4
HOW DOES ANALYTICS FIT IN?
Analytics is the most important piece of infrastructure
• It's what the most headcount is dedicated towards
• It's always instrumented first
• It's what app developers say is the most important
• Single biggest infrastructure spend – regularly talk to app developers that pay more for analytics than everything else combined
4
Slide 5
EVENT DATA IS CORE / TO EVERYTHING ELSE / Push notifications, A/B testing, ad network attribution, / predictive analytics are all useless without event-based / analytics / 5
Visuals: none (the only non-text graphic is the decorative vertical bar at the right edge, listed under elements)
Slide 6
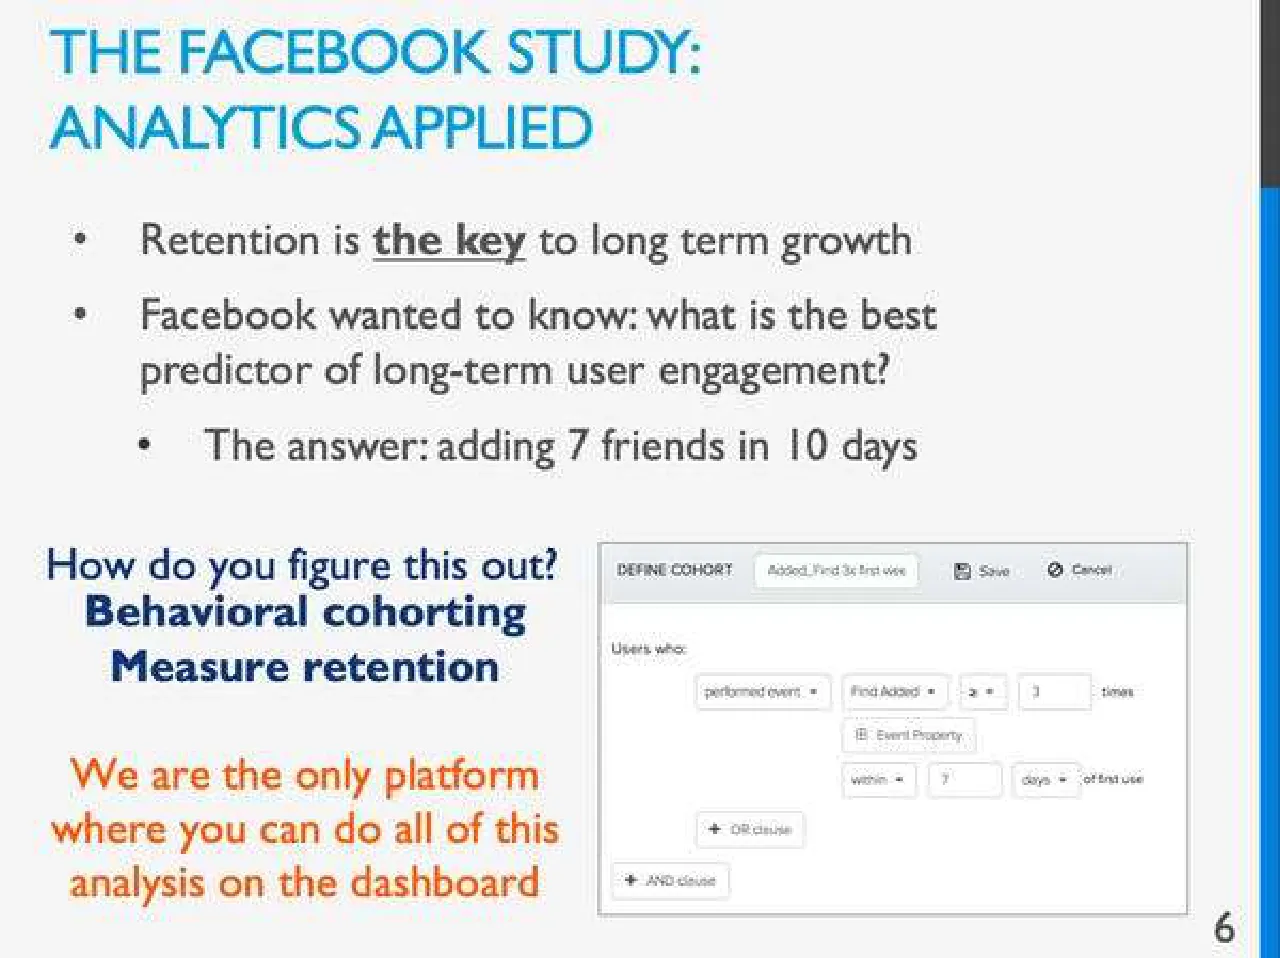
THE FACEBOOK STUDY:
ANALYTICS APPLIED
Retention is the key to long term growth
Facebook wanted to know: what is the best predictor of long-term user engagement?
The answer: adding 7 friends in 10 days
How do you figure this out?
Behavioral cohorting
Measure retention
We are the only platform where you can do all of this analysis on the dashboard
6
DEFINE COHORT
Added_Find 3x first week
Save
Cancel
Users who:
performed event
Find Added
≥
3
times
Event Property
within
7
days
of first use
+ OR clause
+ AND clause
Visuals: One screenshot illustration on the right-lower half: a software dialog titled DEFINE COHORT, shown flat with a thin mid-grey border on a white body and a light grey header strip. The header contains the title DEFINE COHORT in small dark grey capitals, a tab-like white field reading 'Added_Find 3x first week', a floppy-disk Save icon with the label Save, and a circle-slash Cancel icon with the label Cancel. The body reads 'Users who:' at top left, followed by a row of controls: a 'performed event' dropdown, a 'Find Added' dropdown, a '≥' operator dropdown, a number box containing 3, and the word 'times'. Beneath it is an 'Event Property' button with a small icon, then a row with a 'within' dropdown, a number box containing 7, a 'days' dropdown, and the text 'of first use'. Below these are a '+ OR clause' button and, at the bottom left, a '+ AND clause' button. The screenshot is fully visible, not cropped, with no overlay or tint. No chart, table or logo is present.
Slide 7
SOLUTION: AMPLITUDE AS A CONCEPT
Analytics that app teams love,
before and after their app takes off
Better answers to
critical questions
Behavioral cohorting,
User histories
Customer Success Manager is an addition to customer's data science team
Fast, open access to
data
We take care of the whole ETL pipeline
Direct access to raw data on Redshift – no one else does this
Back-end optimized for real-time queries on large volumes
Fair pricing at scale
Flat rate annual Enterprise contracts with room to grow
Pricing lets customers comfortably measure any events they want, even with large user base
7
Visuals: none (the coloured rounded rectangles are text containers and are listed under elements)
Slide 8
SOLUTION: AMPLITUDE AS A / CONCEPT
Analytics that app teams love, / before and after their app takes off
Fast, open access to / data
Fair pricing at scale
Direct access to raw data on Redshift – no / one else does this
Back-end optimized for real-time queries on / large volumes
Flat rate annual Enterprise contracts with / room to grow
Pricing lets customers comfortably measure / any events they want, even with large user / base
Amplitude = / Powerful Analytics at Scale
8
Visuals: None photographic. Five rounded rectangles (cards) in two columns: left column top card (text hidden behind banner), middle card 'Fast, open access to data' and bottom card 'Fair pricing at scale'; right column top card (text hidden behind banner), middle card with two bullets and bottom card with two bullets. Orange rectangle banner spanning the full slide width, overlaying the middle band. The whole slide appears faded (washed out) except the banner, which is fully saturated.
Slide 9
HOW DOES IT WORK IN / PRACTICE? / Dashboard / Processing / Servers / Request / Servers / S3 / Redshift / API / Data / Novel preprocessing architecture / 9
Visuals: Diagram (left to right flow): an Android robot icon in green and an Apple logo in silver-grey stacked at the left, both with a single blue arrow pointing right into a stack of four overlapping grey parallelogram panels labelled 'Request Servers'. A blue arrow points right into a grey 3D box labelled 'Processing Servers'. From the processing box, one blue arrow points up-right to a grey 3D box labelled 'Dashboard', and one blue arrow points down-right to a grey cylinder labelled 'S3'. From Dashboard a blue arrow points right to a screenshot of a dashboard showing a light grey window with a small line chart of light blue wavy lines on white with tiny axis labels; the screenshot is boxed with a thin grey border and has a light grey toolbar. From S3, two blue arrows point down: one left to a grey cylinder labelled 'Redshift', and one right to a stack of grey sheets labelled 'API Data'. Blue arrows are solid medium blue with flat heads; grey shapes have light grey fills with darker grey edges and subtle shading. No chart values are printed.
Slide 10
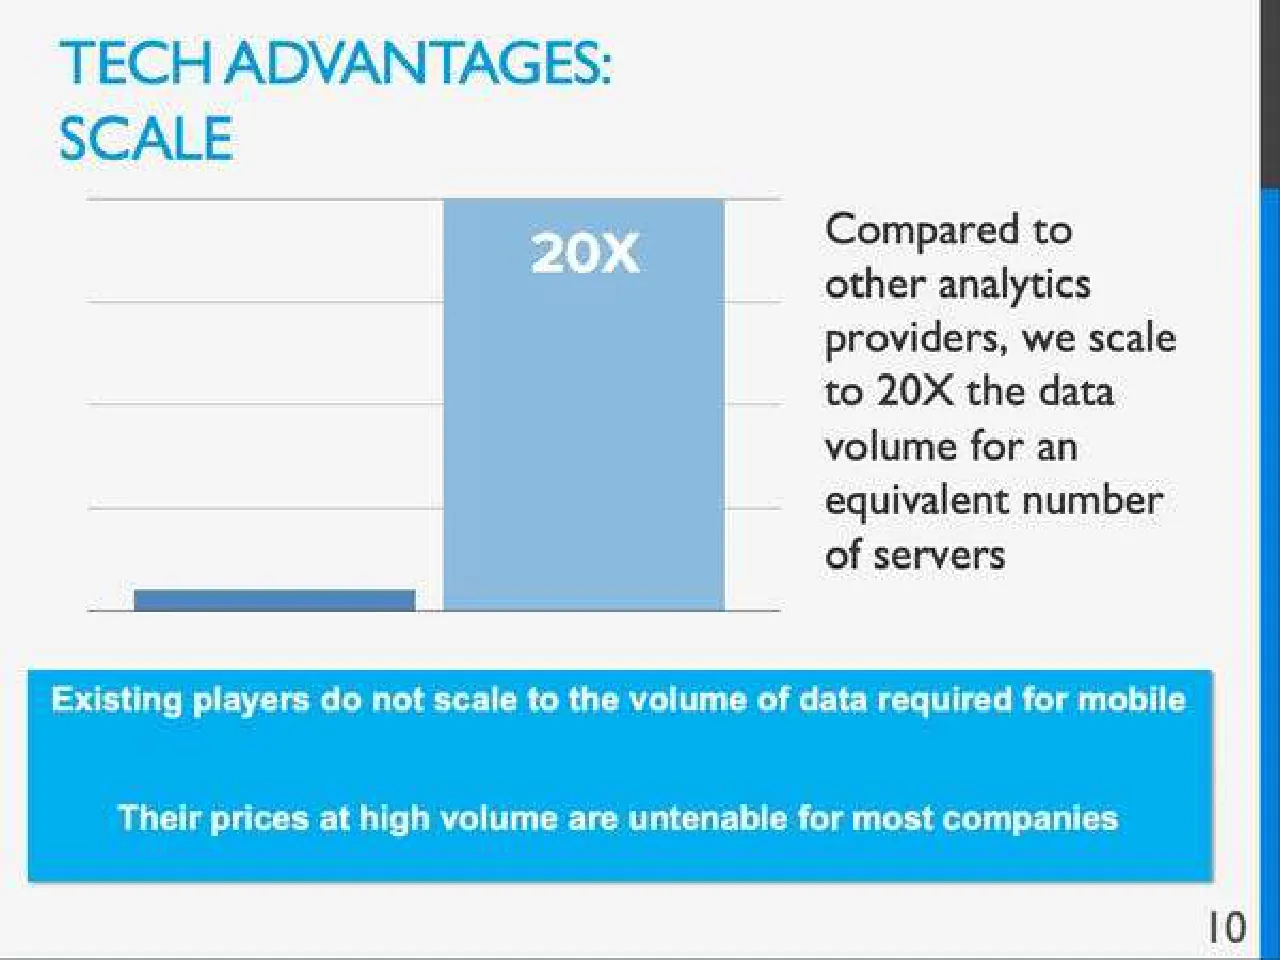
TECH ADVANTAGES: / SCALE / Compared to other analytics providers, we scale to 20X the data volume for an equivalent number of servers / 20X / Existing players do not scale to the volume of data required for mobile / Their prices at high volume are untenable for most companies / 10
Visuals: Bar chart (column chart) with no printed title, no axis labels and no axis values. Horizontal gridlines at roughly four evenly spaced levels with a baseline at the bottom; gridlines are thin light grey (about #C8C8C8, 1 px). Two series, one bar each: a small dark steel-blue bar at about 10% to 32% of slide width, roughly 2% of slide height tall (about 1 unit, so the second bar is about 20 times taller), and a tall light steel-blue bar at about 35% to 57% of slide width, reaching the top gridline (about 20X). The 20X bar is highlighted in lighter blue; the small bar is darker. The label '20X' is printed in white bold sans-serif capitals inside the top of the tall bar. No legend. Chart is boxed by no frame; gridlines extend from about 7% to 61% of slide width.
Slide 11
TECH ADVANTAGES:
ANSWER MORE COMPLEX
QUESTIONS
Behavioral cohorts
Redshift
Go beyond the dashboard to answer more complex questions
Directly query w/ SQL
We house all the raw data
User timelines,
User lists
Drill down to the individual
12
DEFINE COHORT / Day 1 Activation / Save / Cancel / Users who: / performed event / Hunt Started / at least / 1 / times / Event Property / within / 1 / days / of first use / performed event / First Added / at least / 2 / times / Event Property / within / 1 / days / of first use / performed event / Hunt Followed / at least / 5 / times / Event Property / within / 1 / days / of first use / USER / EVENTS / iOS NUX Click / Sign Up / Logged In Visit / iOS Activating / iOS Activated / iOS Signup / iOS Signup / iOS NUX Click / Sign Up / Logged In Visit / iOS Connect Facebook / iOS Activating / iOS Activated / iOS NUX View / Sign Up
Visuals: Two UI screenshots. (1) Upper right: a screenshot of a 'DEFINE COHORT' dialog, boxed with a thin grey 1px border and a light grey toolbar strip across its top containing the label 'DEFINE COHORT', a text field reading 'Day 1 Activation', a Save icon with the word 'Save', and a Cancel icon with the word 'Cancel'. Below, 'Users who:' followed by three condition rows, each with a dropdown reading 'performed event', an event selector ('Hunt Started', 'First Added', 'Hunt Followed'), an 'at least' dropdown, a numeric field (1, 2, 5), the word 'times', and a nested 'Event Property' button with 'within 1 days of first use' rows; rows are separated by thin grey lines and controls have light grey rounded outlines on a white panel. (2) Lower right: a table screenshot with a header row labelled 'USER' and 'EVENTS' and three data rows. Column 1 holds small blue user IDs (blurred). Column 2 holds grey pill-shaped event tags: row 1 'iOS NUX Click', a cyan highlighted 'Sign Up' pill, 'Logged In Visit', 'iOS Activating', 'iOS Activated', 'iOS Signup' (cut off at the edge); row 2 'iOS NUX Click', cyan 'Sign Up', 'Logged In Visit', 'iOS Connect Facebook', 'iOS Activating', 'iOS Activated' (cut off); row 3 'iOS NUX View' and cyan 'Sign Up'. The table is boxed with a thin grey border and the events run past the right edge of the box. Dominant colours of screenshots are white and light grey with cyan #29B6E6 highlights. No photographs, logos or icons.
Slide 12
MARKET SIZE OVERVIEW (TOP DOWN)
ASPs are the highest for event based analytics out of all mobile infrastructure products
CHART 2: GLOBAL BUSINESS INTELLIGENCE MARKET, BY TECHNOLOGIES, 2013-2018 (Y-O-Y %)
35%
30%
25%
20%
2014
2015
2016
2017
2018
Cloud BI
Mobile BI
Social BI
Source: Gartner; Redwood Capital
• BI & analytics market size $14.4B in 2013 (Gartner)
• Mobile business intelligence & analytics market projected to grow at
>20% CAGR; projected >$2 billion market by 2015 (Gartner, Redwood
Capital)
13
Visuals: Chart 2: a line chart titled 'CHART 2: GLOBAL BUSINESS INTELLIGENCE MARKET, BY TECHNOLOGIES, 2013-2018 (Y-O-Y %)'. Y-axis: percent, labelled 20%, 25%, 30%, 35%, range 20% to 35%. X-axis: years 2014, 2015, 2016, 2017, 2018 (categorical). Three series with values not printed on the slide, so estimates are given: Cloud BI (red #D71920, square markers, solid line): about 28% (2014), about 30% (2015), about 32% (2016), about 33% (2017), about 31% (2018), the 2017 peak is highlighted by the highest point. Mobile BI (pink #E8799A, diamond markers, line): about 25%, about 26%, about 27%, about 28%, about 30%. Social BI (dark grey #4D4D4D, triangle markers, line): about 23%, about 24.5%, about 25.5%, about 27%, about 28.5%. Legend below the x-axis in one row: red line with square marker 'Cloud BI', pink line with diamond marker 'Mobile BI', grey line with triangle marker 'Social BI'. Source line in italic beneath the legend. No logos or photographs. The chart is not cropped and sits inside a boxed white panel with a faint grey border and soft shadow.
Slide 13
MOBILE GROWTH,
BIG DATA GROWTH
Axis 3: Mobile
monetization
MOBILE
GROWTH
Axis 1: Established Internet
users shifting from
PCs to mobile
Axis 2: Emerging international
markets - 1st time Internet
users on mobile
14
Visuals: One illustration: a three-axis growth diagram inside a white panel with a soft grey drop shadow. A vertical gold axis arrow (Axis 3: Mobile monetization) rises from a common origin at about 34% x, 62% y. A horizontal gold axis arrow (Axis 1: Established Internet users shifting from PCs to mobile) points right. A diagonal gold axis arrow (Axis 2: Emerging international markets - 1st time Internet users on mobile) points down-right. Two translucent pale gold planes (about #F3E6B8 and #EFDDA0 at about 40% opacity) fill the space between the axes. A thick green arrow (#1E8F2E) runs from the origin up and right, ending in a large arrowhead labelled MOBILE GROWTH. Labels are black text beside each arrow. No chart values, legend or table.
Slide 14
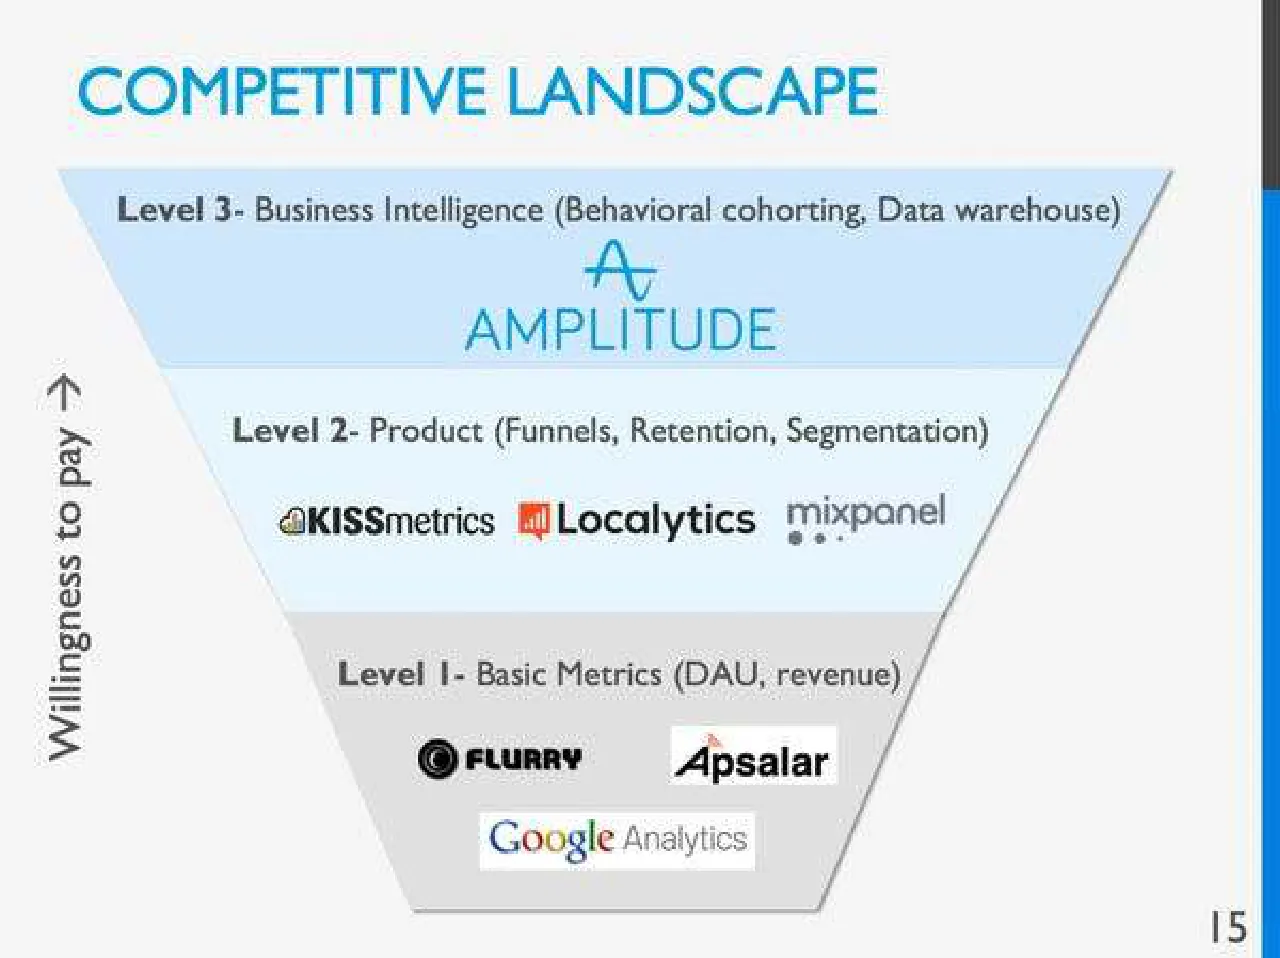
COMPETITIVE LANDSCAPE
Level 3- Business Intelligence (Behavioral cohorting, Data warehouse)
AMPLITUDE
Level 2- Product (Funnels, Retention, Segmentation)
KISSmetrics / Localytics / mixpanel
Willingness to pay →
Level I- Basic Metrics (DAU, revenue)
FLURRY / Apsalar
Google Analytics
15
Visuals: Diagram: an inverted funnel divided into three horizontal tiers. Top tier (light blue, about #CFE6F8) labelled 'Level 3- Business Intelligence (Behavioral cohorting, Data warehouse)' with the Amplitude logo below it: a blue stylised wave-A mark above the word AMPLITUDE in blue capitals. Middle tier (very pale blue, about #E6F2FB) labelled 'Level 2- Product (Funnels, Retention, Segmentation)' with three logos in a row: KISSmetrics (cloud icon with wordmark), Localytics (orange-red bar icon with wordmark), and mixpanel (grey wordmark with three dots). Bottom tier (mid grey, about #D9D9D9) labelled 'Level I- Basic Metrics (DAU, revenue)' with logos: Flurry (black concentric circle icon with FLURRY wordmark), Apsalar (black wordmark on white box), and Google Analytics (coloured Google wordmark with grey 'Analytics' on a white box). Thin grey diagonal outline forms the funnel sides; a thin grey base line closes the bottom. A vertical arrow label 'Willingness to pay →' runs upward along the left side in dark grey.
Slide 15
EXTENSIVE COMPETITIVE LANDSCAPE / Out-of-the-box / Event based analytics / Generic big data / systems/ / ETL Pipeline / natero / miato / Write your own queries / inter | ana / Keen IO / Mobile / Marketing / (push notifs, A/B testing) / kahuna / swrve / AMPLITUDE / mixpanel / Localytics / KISSmetrics / Free / FLURRY / Google Analytics / 16
Visuals: Logo-only composition with no photographs or charts. Logos: natero (blue wordmark with a small blue folder-network icon, left column), miato (blue wordmark with a blue speech-bubble icon with a green dot, left column), inter|ana (black bold wordmark with a vertical black bar between inter and ana, left column), Keen IO (white wordmark and triangle icon on a dark slate box, left column), AMPLITUDE (blue wordmark with a blue wave-A icon above, centre), mixpanel (grey wordmark with three grey dots below, centre), Localytics (black wordmark with an orange bar-chart icon, centre), KISSmetrics (black wordmark with a small orange-brown cloud icon, centre), FLURRY (black bold wordmark with a black circle icon, inside the free box), Google Analytics (multicoloured Google wordmark followed by grey Analytics, inside the free box), kahuna (white wordmark with a white circle icon on a purple box, right), swrve (black bold italic wordmark, right). The centre column has a solid blue rectangle with white bold text. Inside a dashed grey rectangle under the centre logos, the word Free sits above the FLURRY and Google Analytics logos.
Slide 16
TRACTION CONTINUED
Customers switching from:
mixpanel
Localytics
OMNITURE
So far: zero marketing spend, all inbound leads
19
Visuals: Three company logos in a row, each on a white box with a soft drop shadow. Left: a mixpanel wordmark in dark blue #1F4E79 in lowercase with three dots beneath it, on a wide white rectangle. Centre: a Localytics logo, an orange #F26B1D speech-bubble icon containing a rising bar chart above the black wordmark 'Localytics', on a near-square white box with a thin grey border. Right: an Omniture logo, a red #E8141B Adobe-style 'A' mark on a white box, with 'OMNITURE' in small grey capitals below and three short horizontal bars beneath it (two grey, one green). No charts, photographs or other illustrations.
Slide 17
DISTRIBUTION
Enterprise sales process
Annual Commitments
Up-front quarterly or monthly payments
Estimated $1MM ARR per sales rep per year
20
Visuals: Three stacked rounded rectangles as a vertical sequence of tiers, top to bottom: (1) light sky-blue box with the text 'Annual Commitments'; (2) medium bright blue box with 'Up-front quarterly or monthly payments'; (3) deep royal blue box with 'Estimated $1MM ARR per sales rep per year'. No arrows, chart or photographs. Boxes are flat with no shadow, equal width, even vertical gaps of about 2% of slide height.
Slide 18
LONG TERM COMPETITIVE / ADVANTAGES / Great core / engineering stack / allows much better scaling and / faster iteration than any existing / company in the space / Stellar / Engineering / Team / Ownership of / the mobile / data stack / 23
Visuals: Three filled rectangles with no visible borders or rounded corners, each carrying a text label. Left box: light sky blue #7FD0F5 with pale white text and small body line. Upper-right box: bright blue #0E8EE6 with white text. Bottom box: deeper royal blue #1558B0 with white text. No photographs, charts, icons or logos.