
The source: the 57-slide “Anthropic Roadshow Presentation” dated November 2026, opened from the retail agenda page NetRoadshow serves for the offering; the 42-minute roadshow video Anthropic streams from ipo.anthropic.com, with its captions; the 15-page IPO Fact Sheet and the eight-page founders’ letter from the same site; and the preliminary prospectus (the Form S-1) dated 10 November 2026, which we used to check figures. Reviewed on 10 November 2026 from the materials as published that day. The roadshow slides are served to each viewer with a personal watermark and a confidential footer, so we do not reproduce them. Instead we rebuilt all 57 in our own layouts, keeping the order, titles, figures and footnotes; those pages are marked as reconstructions and shown below beside the graphic cards from the public video and pages of the public fact sheet. Nothing here is investment advice; it is a review of how the materials make their case.
Open Anthropic’s IPO site (opens in a new tab)The deck, reconstructed
All 57 slides rebuilt by SlideDeck Co in our own layouts, with the original’s order, titles, figures and footnotes. Every page is marked as a reconstruction. The original is served to roadshow viewers with each copy stamped with the viewer’s own address, so we do not reproduce or link it.
Open the PDF (57 pages)
Library entry, with slide-by-slide text, the video and its transcript
The documents
The 15-page fact sheet, the founders’ letter and the preliminary prospectus, all on Anthropic’s IPO site.
IPO Fact Sheet (PDF)
Founders’ letter (PDF)
Preliminary prospectus (PDF)
The video
42 minutes 43 seconds in eleven chapters, streamed by Anthropic from its IPO site with captions.
Watch at ipo.anthropic.com
Library entry, with the full transcript
| Term | What the materials say | Where |
|---|---|---|
| Ticker and exchange | ANT on Nasdaq | Slide 3; prospectus cover |
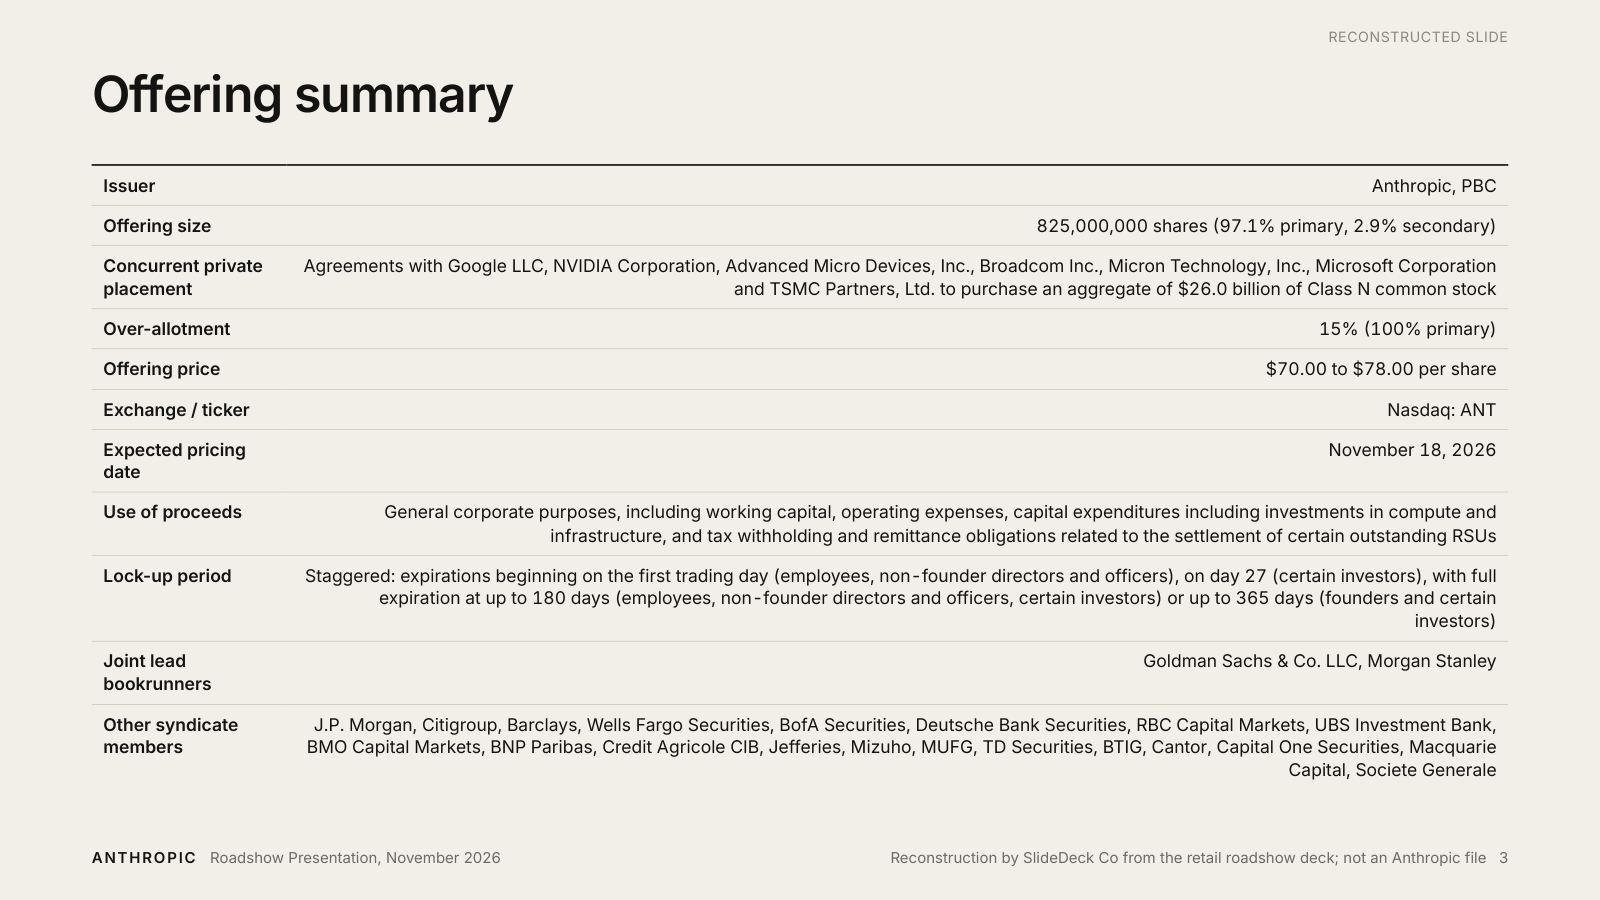
| Shares offered | 825,000,000 Class A shares, 97.1% of them new, with a 15% over-allotment option | Slide 3; prospectus cover |
| Price range | $70.00 to $78.00 a share | Slide 3; prospectus cover |
| Concurrent private placement | $26.0 billion of non-voting Class N stock, bought by Google, NVIDIA, AMD, Broadcom, Micron, Microsoft and TSMC Partners at the offer price | Slide 3; prospectus summary |
| Net proceeds | About $84.6 billion at the $74 midpoint, for general corporate purposes including compute and infrastructure | Slide 3; prospectus, use of proceeds |
| Expected dates | Pricing on 18 November 2026, first trading day 19 November 2026 | IPO site FAQ |
| Lock-ups | Staggered, from the first trading day for some employees to 365 days for the founders | Slide 3; prospectus |
| The materials | A 57-slide roadshow deck, a 42-minute 43-second video in eleven chapters, a 15-page fact sheet and an eight-page founders’ letter | ipo.anthropic.com, and our reconstruction above |
Read it as a retail investor deciding whether to ask for shares.
The agenda page is the retail route into the roadshow, and the fact sheet and video are built for people who will request shares through a brokerage app rather than meet the bankers. After these materials, that reader should understand what Anthropic sells, how it earns money and at what margin, what it has committed to spend, who controls the company, and the terms of the offer. We judge every slide against that job.
The terms are on slide 3 and in the prospectus. Anthropic is offering 825,000,000 Class A shares at $70.00 to $78.00, 97.1% of them new shares, with a 15% over-allotment option. Seven partners (Google, NVIDIA, AMD, Broadcom, Micron, Microsoft and TSMC Partners) have agreed to buy $26.0 billion of non-voting Class N stock in a concurrent private placement at the offer price. The ticker is ANT on Nasdaq. Pricing is expected on 18 November 2026 and trading on 19 November, according to the site’s FAQ. Net proceeds at the $74 midpoint are about $84.6 billion, for general corporate purposes including compute and infrastructure. Lock-ups are staggered, from the first trading day for some employees to 365 days for the founders.
Three things about that ask are not on the slide. The founders’ LLC will hold a single Class F share carrying 50.1% of the voting power on most matters. The Long-Term Benefit Trust, through Class T stock, elects and removes a majority of the board. Anthropic will be a “controlled company” under Nasdaq rules. The prospectus puts all three on its cover; the roadshow deck mentions the trust once, in the fact sheet’s wording, and never states the founders’ voting share. We come back to this in the changes.
The roadshow deck, slide by slide: three announced sections, and an appendix that does the hard work.
The reconstruction follows the original slide for slide; the slide numbers below are the deck’s. The deck is built in three movements, each opened by the same divider (slides 6, 18 and 32): core advantages, enterprise adoption of Claude, and what it calls an unprecedented financial model. A 14-page appendix follows with commitments, definitions, GAAP statements and reconciliations. The signposting is clear. The argument is that Anthropic turns compute into revenue more efficiently than anyone else, and that the efficiency compounds. Most of the deck is evidence for that claim.
1 to 5 Terms, mission and the size of the prize
After the title and a dense legal disclaimer, slide 3 is a clean offering summary table: issuer, size, placement, over-allotment, price range, exchange, pricing date, use of proceeds, lock-ups and 22 banks. It is the most useful single page in the deck for a retail reader, and a table is the right form for it. Slide 4 states the mission that is also the company’s legal public benefit purpose. Slide 5 draws a revenue curve from commercial launch in 2023 to $17 billion of revenue in the third quarter of 2026 beside a “$40T+ knowledge work” figure. The footnote admits the curve is “interpolated between disclosed points,” so the line is drawn through two measured points. The $40 trillion comes from a wage-based estimate explained on slide 48. Both are framing, and both are labelled as framing.
6 to 17 Core advantages: talent, research, compute, enterprise
Slide 9 shows the seven co-founders and two retention figures: all seven still at the company and about 1% trailing regrettable attrition. Slide 10 is the deck’s one benchmark chart, Terminal-Bench 4.0 score against cost per attempt on a log scale, with the claim that Opus 5.5 at default effort beats Opus 5 at maximum effort for about a fifth of the cost and matches GPT-6 Astra at about 40% of the cost. One benchmark is a thin basis for “excellence in research,” and the deck seems to know it: slide 15 argues that benchmark scores have “limited efficacy” and that business outcomes are the measure, which is in tension with slide 10.
Slides 13 and 14 carry the deck’s central idea. Compute from four chip families (AWS Trainium, Google TPUs, NVIDIA GPUs and AMD GPUs) is treated as one fungible pool, and “compute multipliers,” algorithmic improvements that raise the output of a unit of compute, stack on each other. Slide 14 is illustrative, a small grid becoming a large grid, and says so. Slide 16 draws two reinforcing loops, improvement and investment. Slide 17 is the first number that gives us pause: “increase in code contributed per engineer” rising from 1.0x in 2024 to more than 45x in the third quarter of 2026, with more than 90% of contributions to the codebase written by Claude. The footnote defines the measure as lines of code merged per active human contributor, including code Claude wrote. Lines of code is a weak measure of engineering output, and a 45x rise in lines merged says as much about how agents write code as about productivity. The deck uses it twice more (slides 39 and the video’s chart). We would keep the fact and label it for what it is.

18 to 31 Enterprise adoption: the strongest and the weakest evidence
This section has the deck’s best disclosures and its least checkable ones side by side. Slide 29 says ten of the ten largest software, internet and banking companies in the Fortune 500 use Claude, defined as $100,000 or more of trailing spend. Slide 30 charts honestly. It says more than 50% of the Fortune 500 spends $100,000 or more, then shows that the average Fortune 500 customer’s Claude spend is under 0.1% of its total expenses and the ten largest customers’ under 1%, on an axis that runs to 90% so the bars are visibly tiny. That is the right way to show headroom. Slide 35 gives the customer counts behind the $100,000 metric, from about 20 at the end of 2023 to more than 11,900 at 30 September 2026, and states that 79% of third-quarter revenue came from outside the top five customers. That last figure is the only concentration disclosure in the deck; the prospectus lists concentration among its principal risks.
Against that, slide 23 compares the run-rate revenue of Claude Cowork and Claude Code by days since each product’s research preview and has no values on its vertical axis, so the reader cannot judge the gap. Slide 28 shows three unnamed customers growing 69x, 168x and 115x year over year; the bases are $0.1 million to $0.4 million of quarterly revenue, which is where such multiples come from. Slide 27 states net revenue retention of about 900%. The appendix definition (slide 47) excludes the consumer subscription plans and measures customers with at least $1 of revenue in the base quarter, so the figure is dominated by accounts that were almost nothing a year ago. All three slides describe real growth, but none of them lets a reader check the claim, and the deck leans on the 900% in the body and again in the video.
Slide 26 is the customer proof page: Mercado Libre, Salesforce, Bristol Myers Squibb, AIG, Walmart and Legora, each with one figure. Slide 31 opens the new lines of business, cybersecurity, life sciences and robotics, with the one verifiable programme figure in the section: more than 129,000 verified vulnerabilities found by partners between April and July 2026.
32 to 43 The financial model, and where the GAAP figures sit
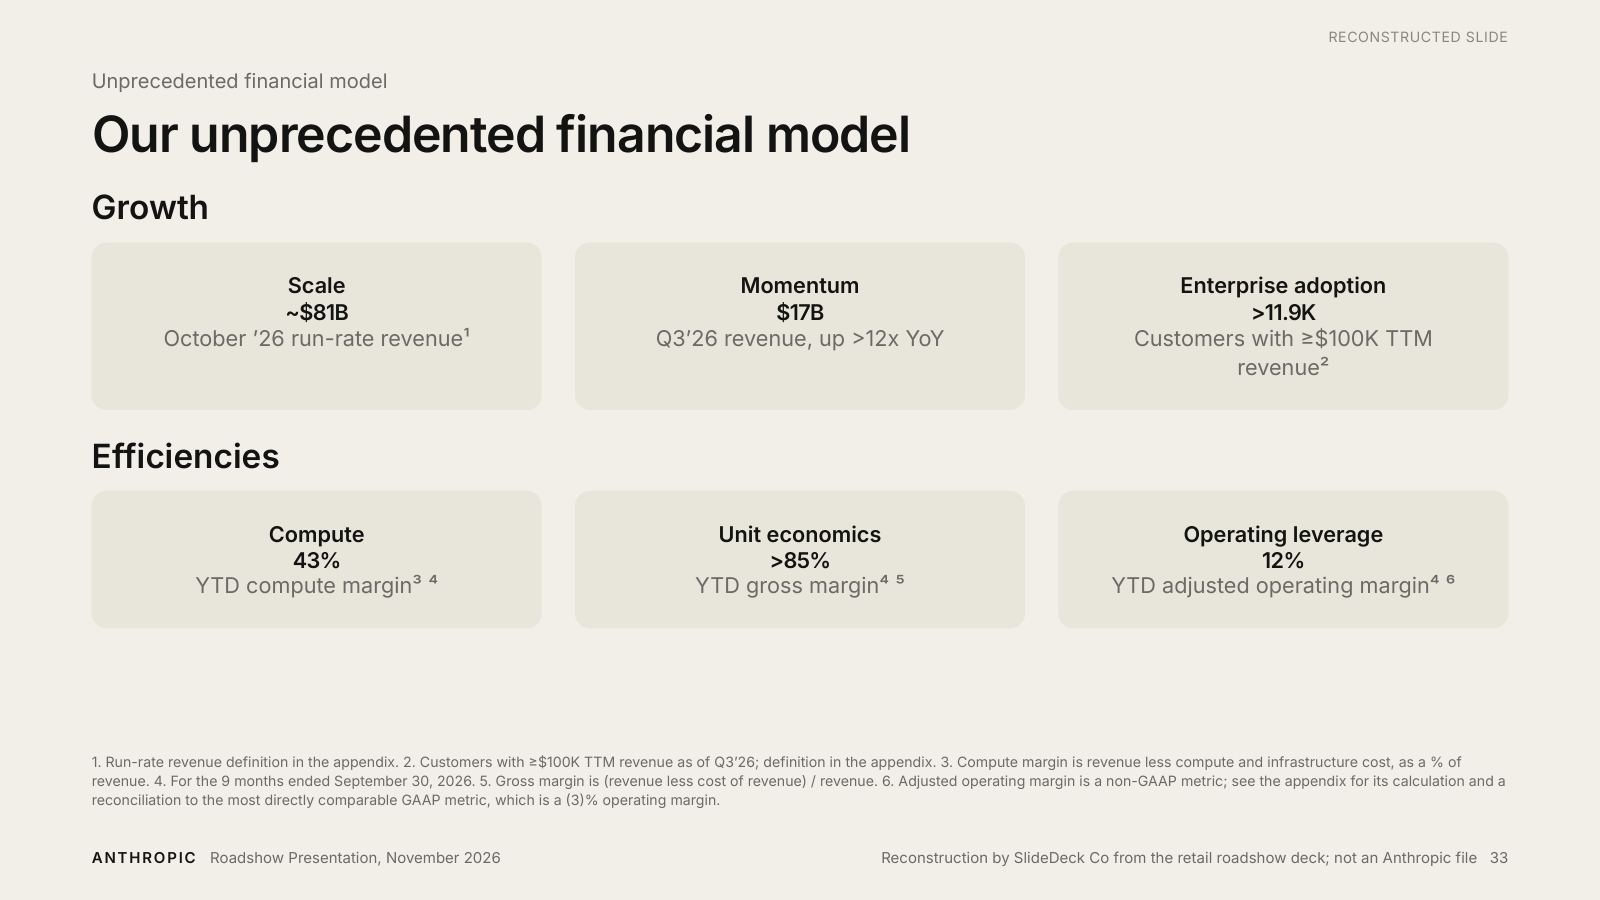
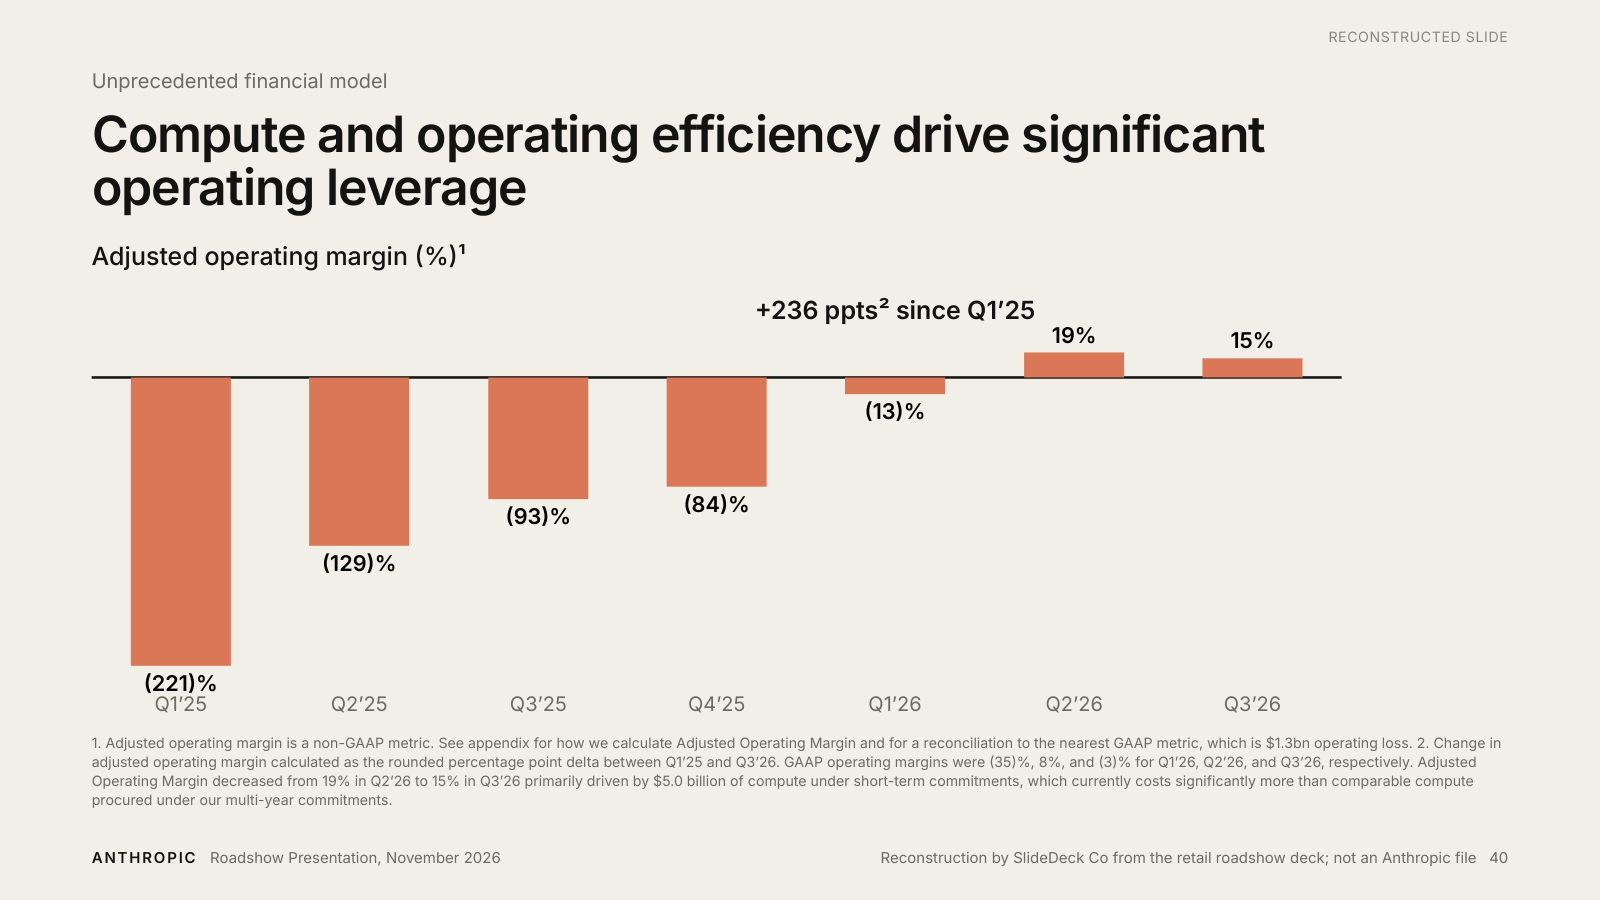
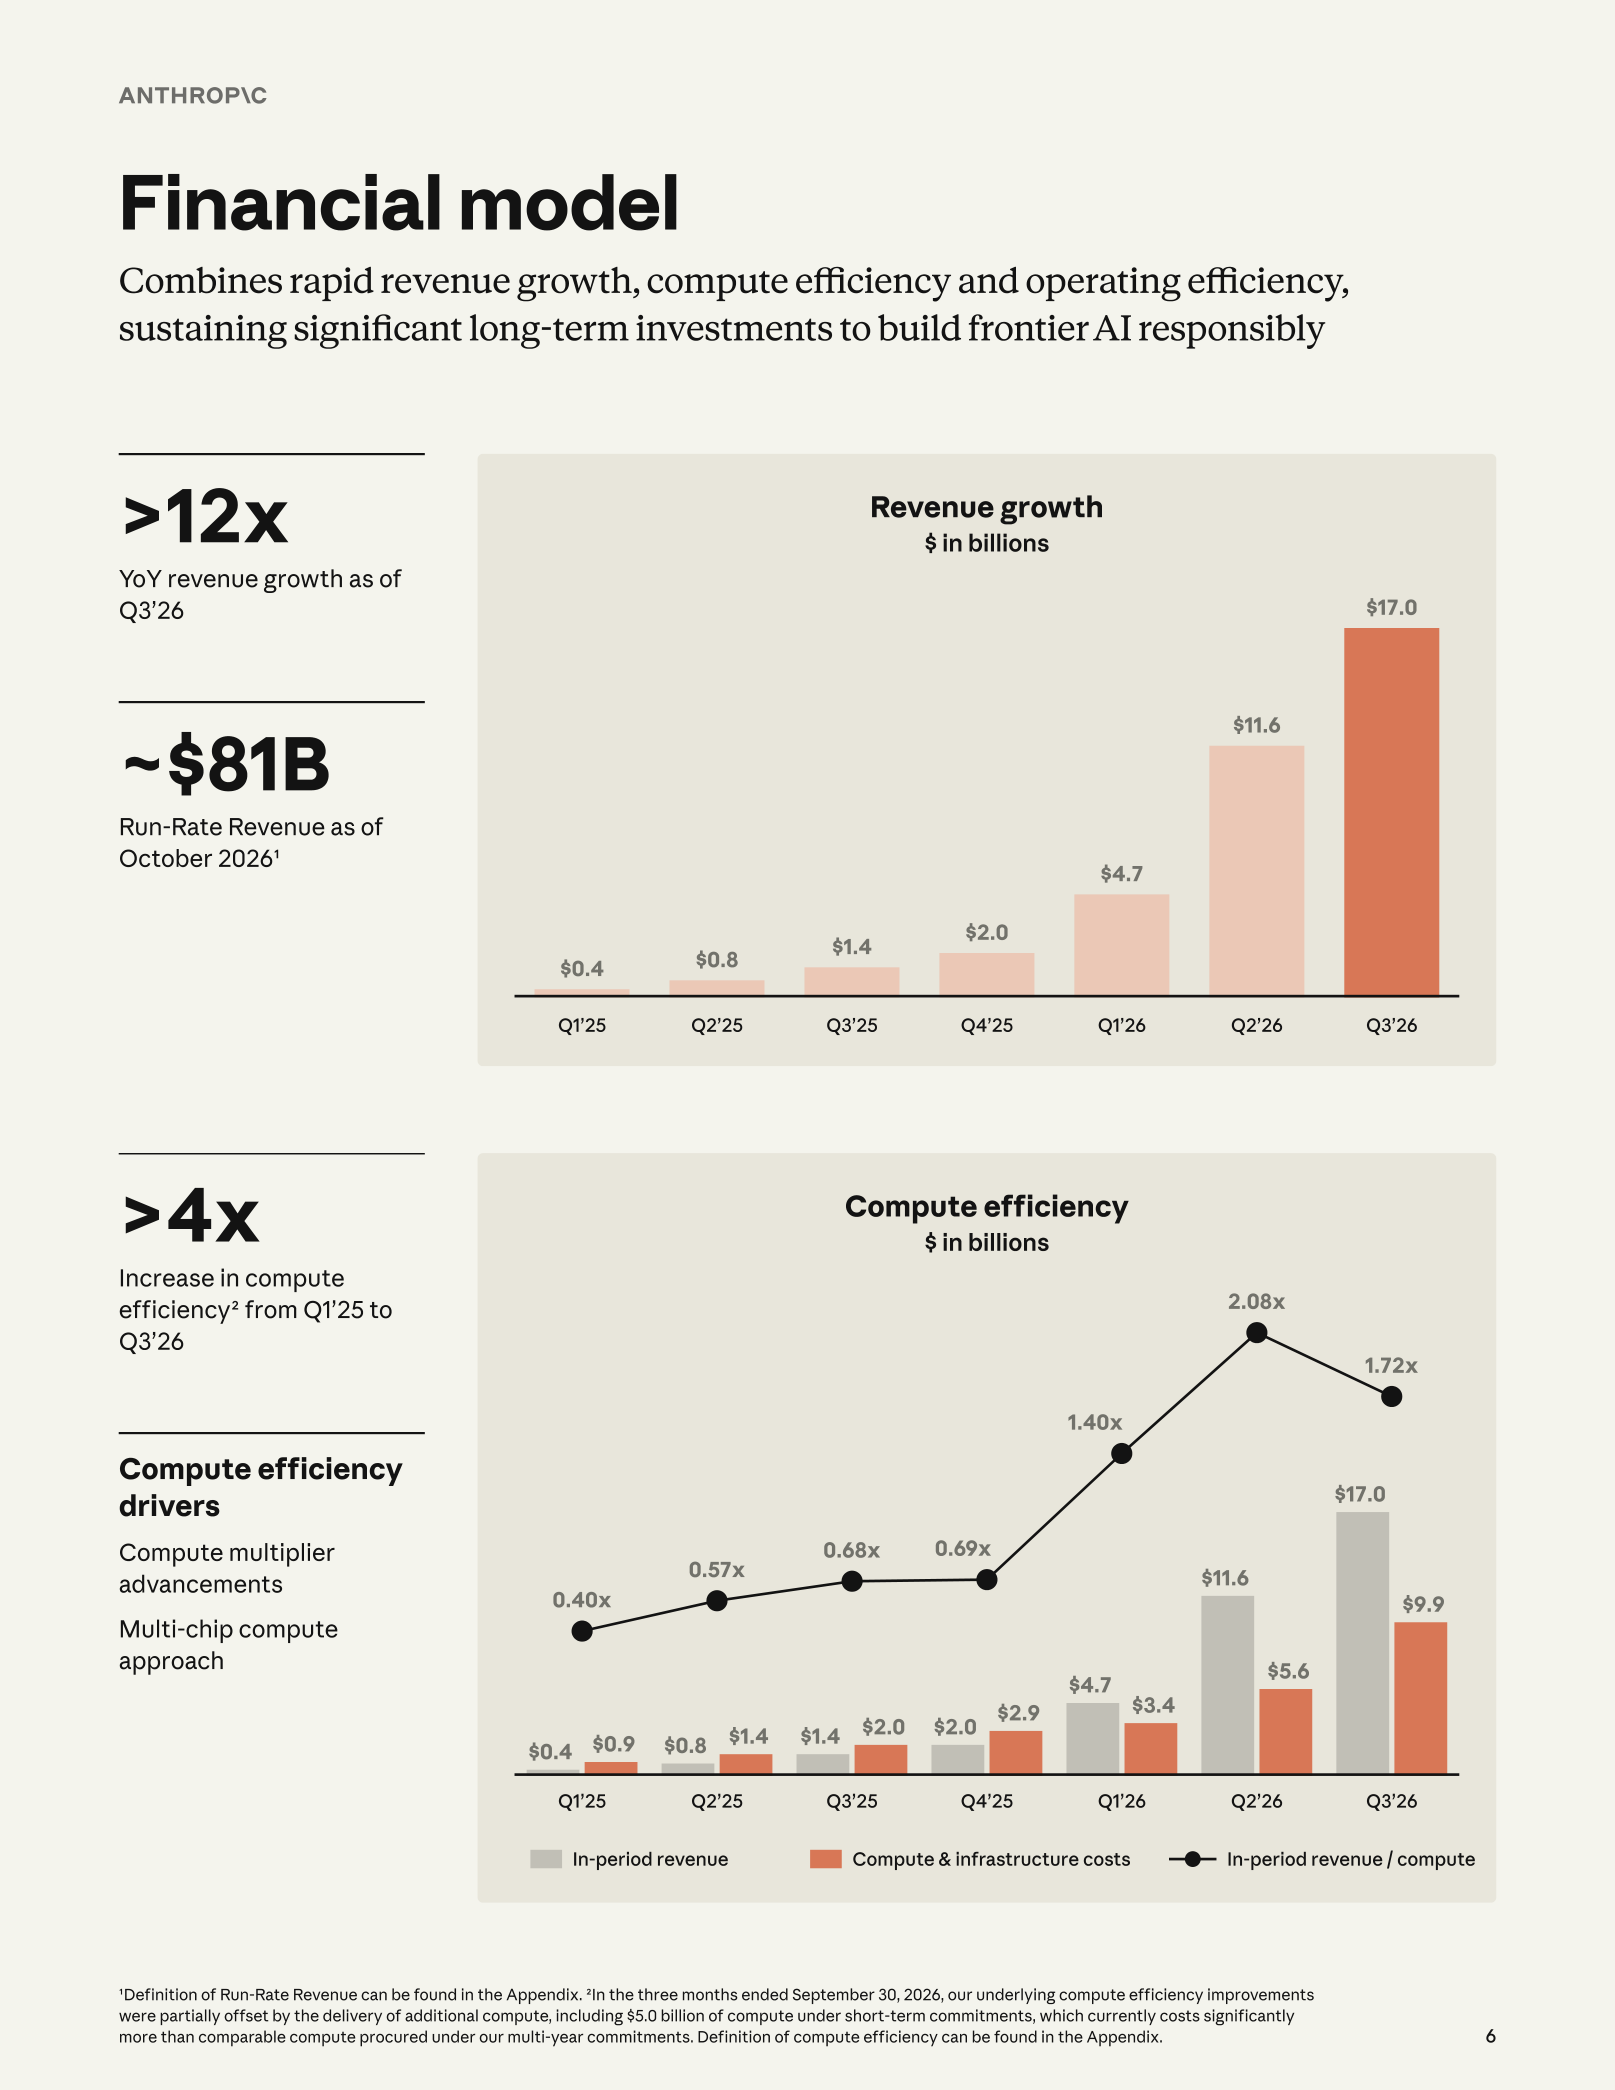
Slide 33 is the headline page: about $81 billion of October run-rate revenue, $17 billion of third-quarter revenue up more than 12x, more than 11,900 customers, a 43% year-to-date compute margin, more than 85% gross margin and a 12% adjusted operating margin. The GAAP operating margin for the same nine months, (3)%, is in the footnote. Slide 40 charts adjusted operating margin from (221)% in the first quarter of 2025 to 15% in the third quarter of 2026, and its footnote gives the GAAP equivalents for 2026: (35)%, 8% and (3)%. The third-quarter net loss, $23.3 billion including a $21.9 billion non-cash charge from the revaluation of convertible notes, appears only in the appendix tables on slides 49 and 50. All of it is disclosed; the problem is where, and the changes below deal with that.
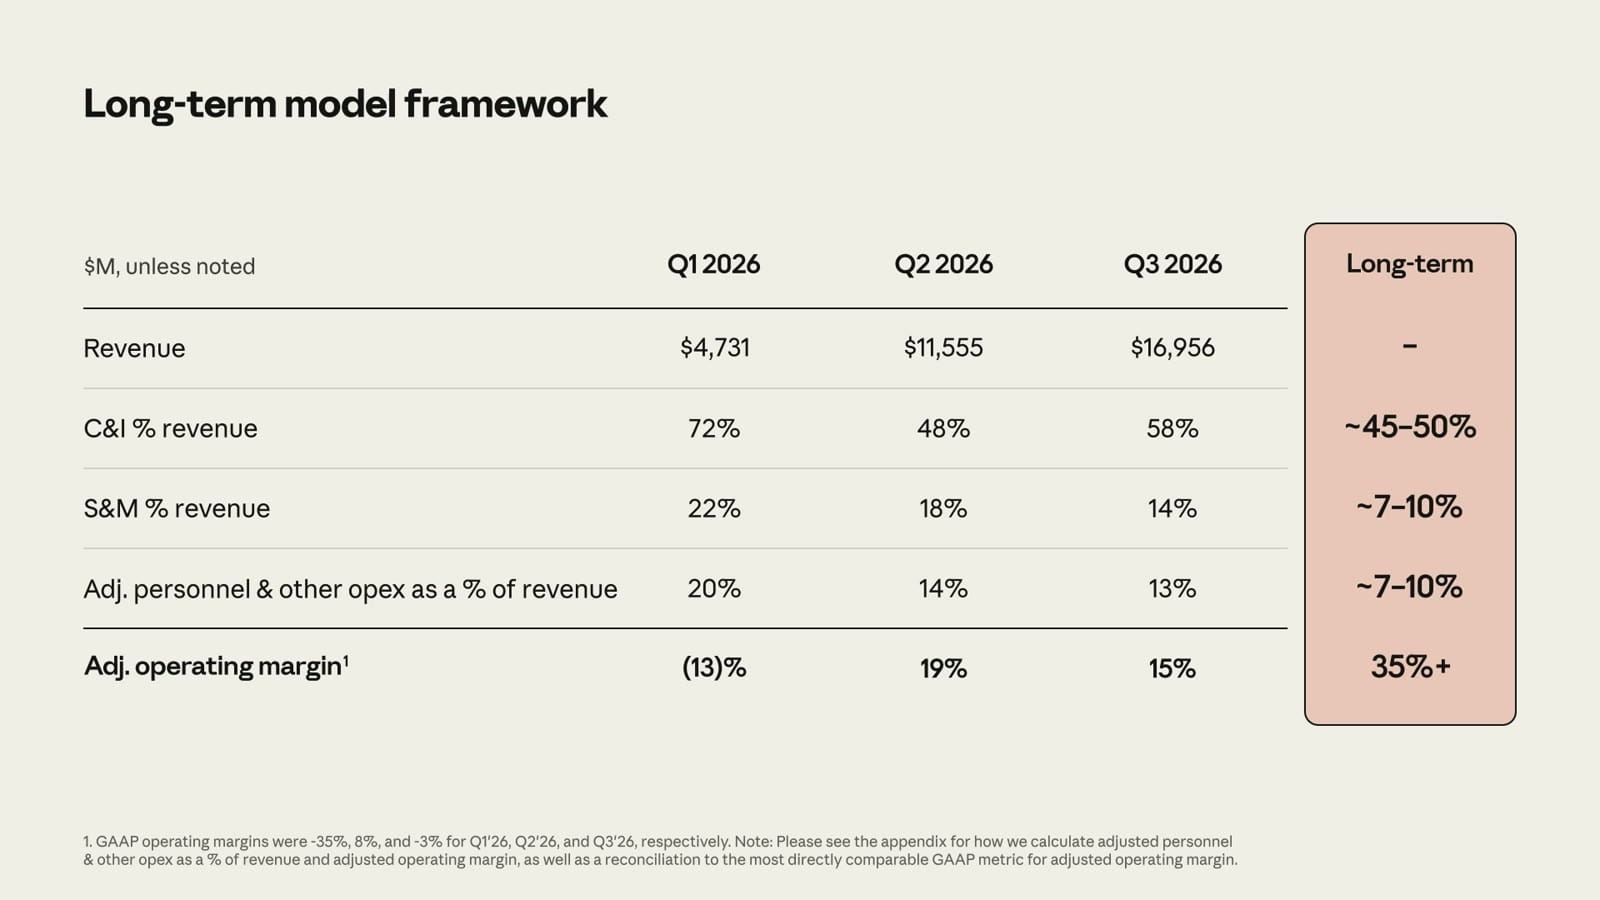
The section also contains the deck’s most candid chart. Slide 38 plots quarterly revenue against compute and infrastructure cost for seven quarters and shows the efficiency ratio rising from 0.40x to 2.08x and then falling to 1.72x in the third quarter of 2026. The footnote explains why: $5.0 billion of compute bought under short-term commitments, “which currently costs significantly more” than multi-year capacity. Slide 41 then explains the three ways Anthropic buys compute, from its own leased chips in purpose-built data centers (“Anthropic Direct”) through multi-year cloud deals to short-term capacity for peaks. Slide 43 gives the long-term framework in a table: compute and infrastructure trending to about 45 to 50% of revenue, sales and marketing and other operating costs to about 7 to 10% each, and an adjusted operating margin of 35% or more. The video repeats the table almost exactly.
44 to 57 The appendix
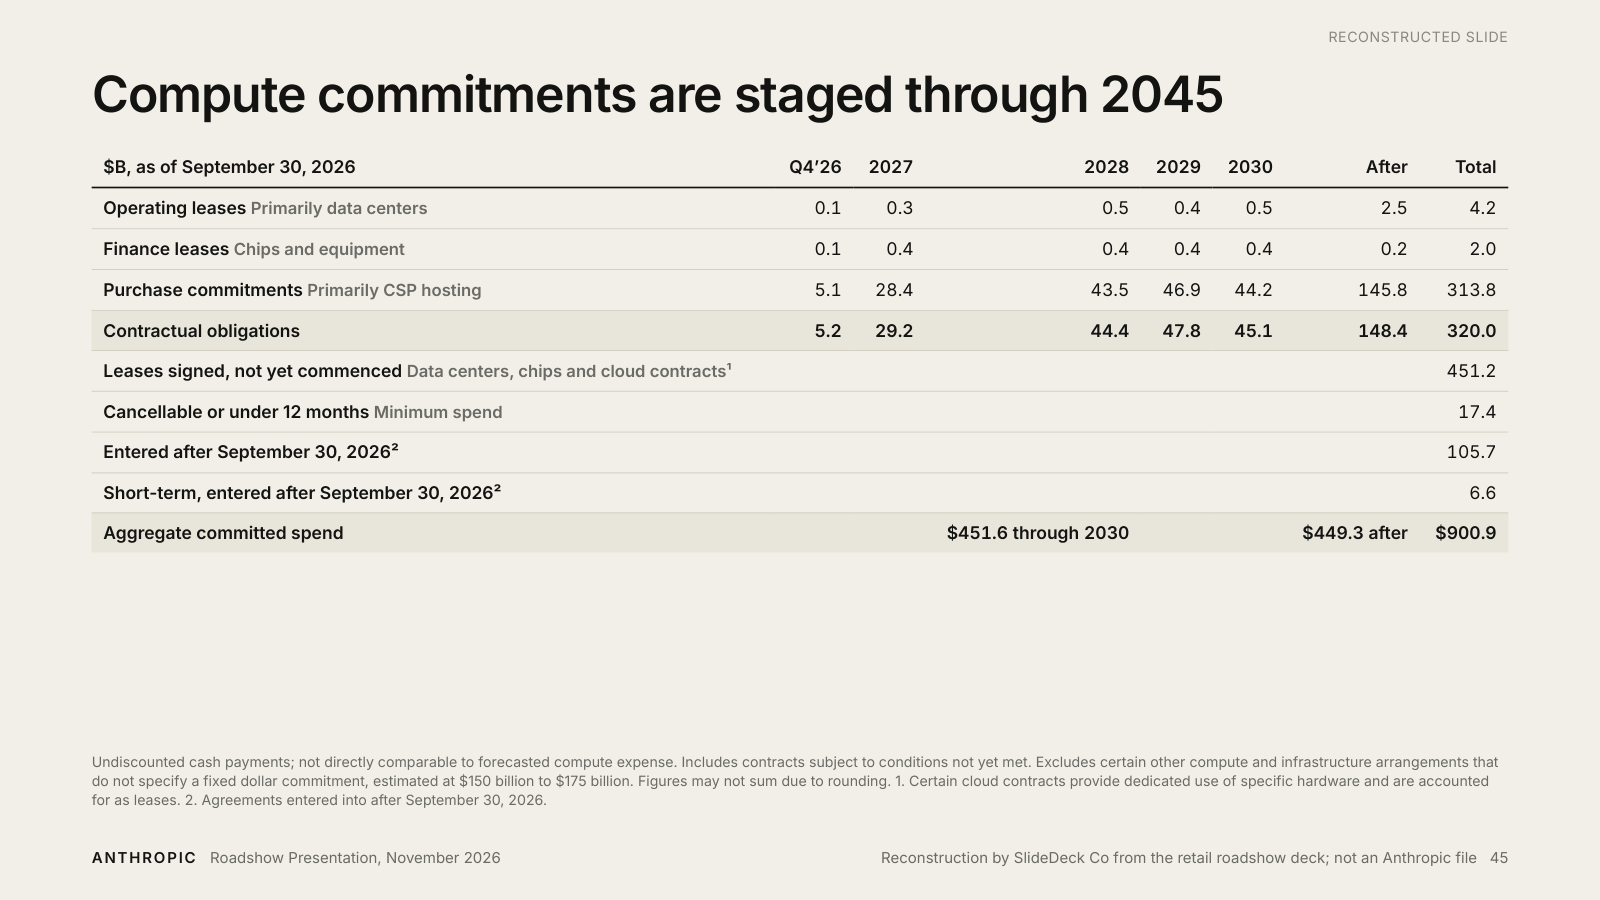
Slide 45 is the page a retail investor most needs and is least likely to reach: compute commitments by year. Contractual obligations of $320.0 billion, leases signed but not yet commenced of $451.2 billion, and $105.7 billion entered after the quarter end add to aggregate committed spend of $900.9 billion, with $451.6 billion expected before the end of 2030 and the rest between 2031 and 2045. Slides 46 to 48 define every non-GAAP term and the knowledge-work estimate. Slides 49 to 53 give annual and quarterly GAAP statements and reconciliations: revenue of $41 million in 2023, $386 million in 2024 and $4.6 billion in 2025, with net losses of $1.5 billion, $8.3 billion and $42.0 billion, the last including a $34.3 billion fair-value charge and a $1.5 billion copyright settlement. Slides 54 to 57 are the regional disclaimers for Australia, Japan, the United Kingdom, the European Economic Area and Switzerland, which tell you the retail offer is global.
The 42-minute roadshow video says less and, in one place, shows more.
The roadshow video runs 42 minutes and 43 seconds in eleven chapters, on the IPO site and on NetRoadshow. Executives speak to camera between simple cream-coloured cards, and three customers (Bristol Myers Squibb, Accenture and AIG) speak for themselves. The cards are plainer than the slides, and the financial six-pack among them puts the GAAP operating margin, (4)%, and positive free cash flow next to the adjusted figures, which slide 33 does not.
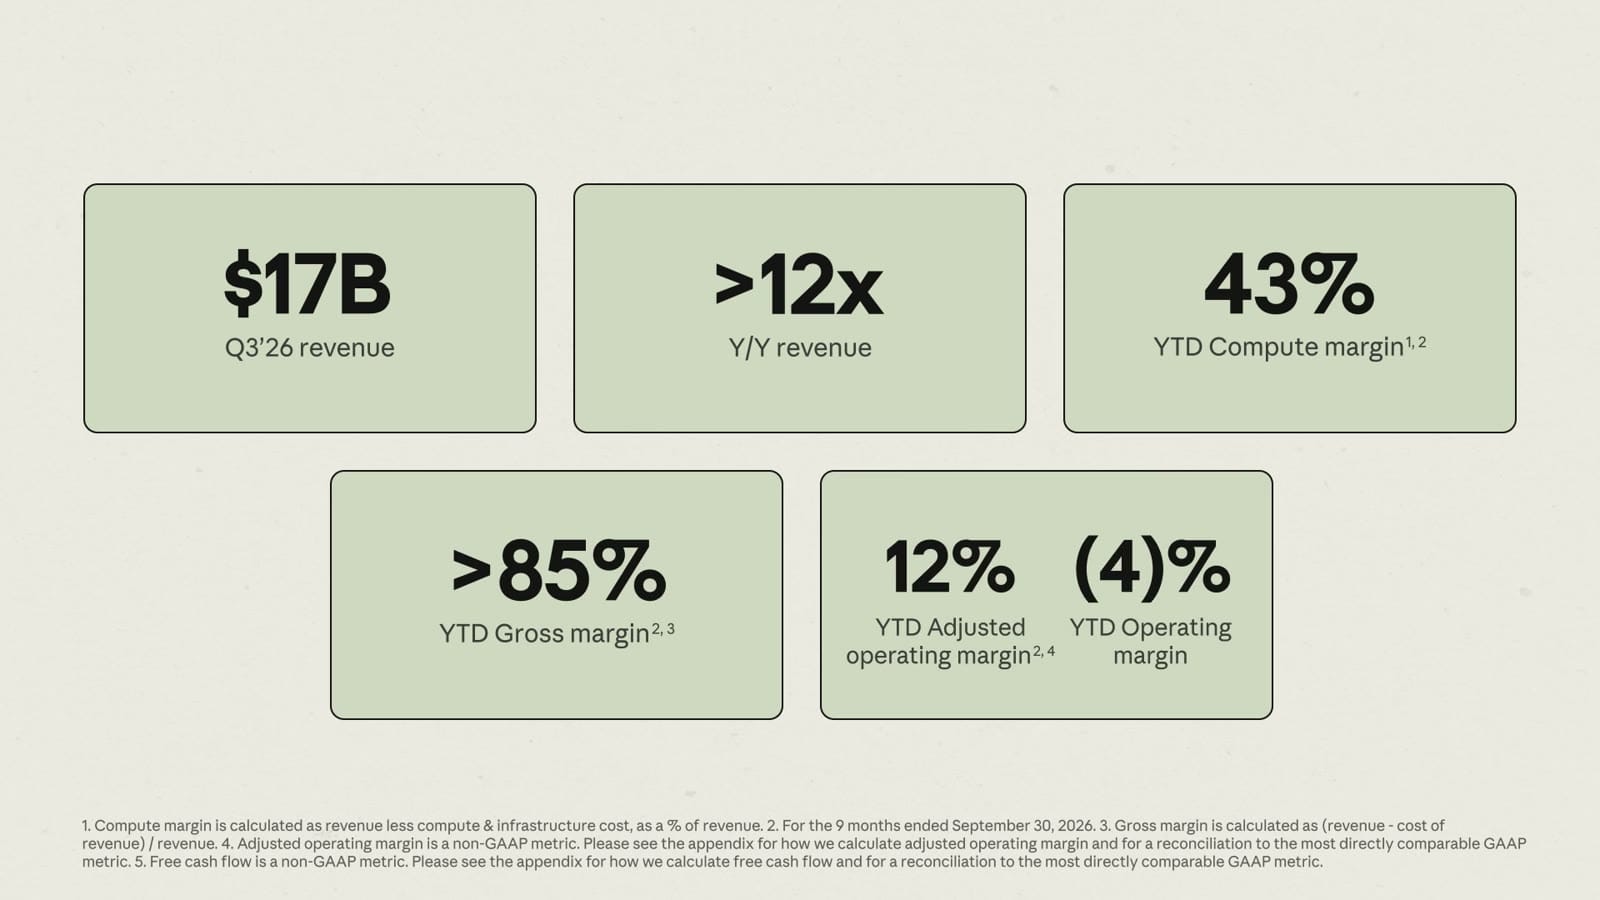
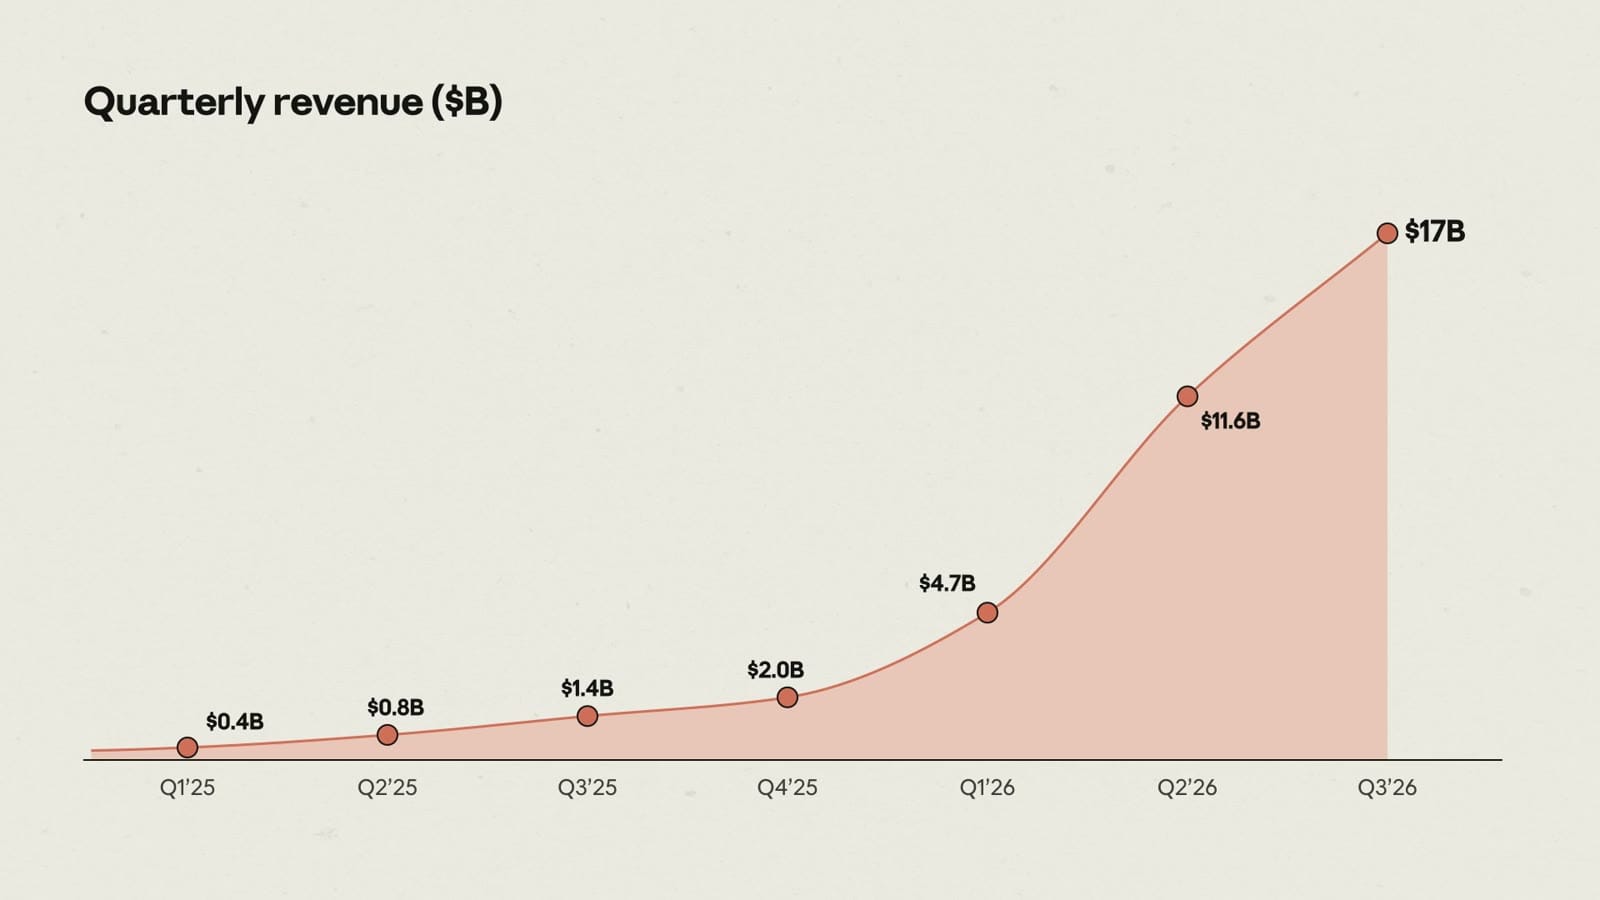
The first ten minutes cover mission, talent and the product principles: meet customers where they are, build models and products side by side, and close the gap between the frontier and daily work. A short section of employees answering “Why do I work at Anthropic?” is the only personal passage in any of the materials and it earns its place. The research chapter explains pre-training and reinforcement learning in two sentences each and tells the Opus 5.5 story of a 680,000-line code migration completed in under a day. The compute chapter, delivered by the co-founder the video names as Chief Architect, is the clearest explanation of the thesis in any of the materials: four chip families run as one pool, a worked example of what a 4x multiplier means, and the claim that Mythos got Claude running on AMD GPUs in three days with almost no human intervention.
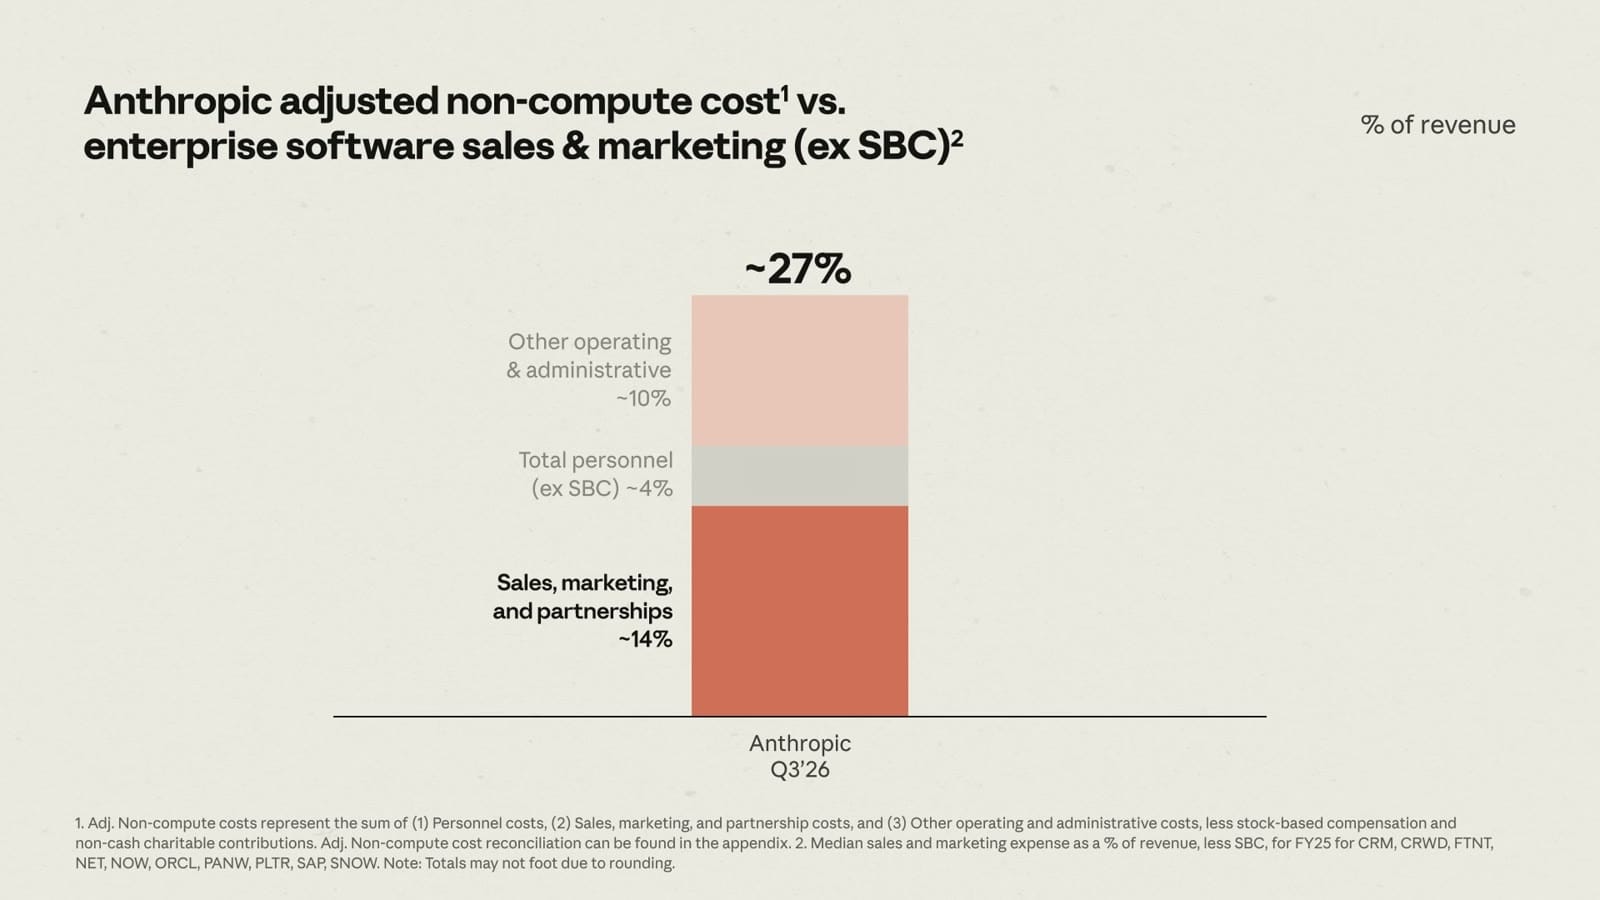
The financial chapter, at about ten minutes, restates slide 33, slide 38 and slide 43 and adds a comparison the deck lacks: Anthropic’s adjusted non-compute costs, about 27% of revenue, against the median enterprise software company’s sales and marketing alone, about 31%. It says the company is “in an aggressive investment mode” and names compute, customer value and safety as the three areas of spend. It never says the net loss figure, the $21.9 billion revaluation charge or the $900.9 billion of commitments, and no speaker mentions the founders’ 50.1% vote. The video’s own “Aggregate commitments” card is a schematic about when payments fall due relative to capacity, with no amounts on it.
The customer segments are the video’s advantage over the deck. Bristol Myers Squibb’s speaker describes rolling Claude out to 30,000 employees and cutting a real-world evidence question from one or two months to four or five minutes, which is the same figure as slide 26 with the mechanism attached. Accenture describes scans that took days now taking under an hour. AIG’s speaker talks about regulators and human oversight, which is a more useful thing for a retail investor to hear than the 90% figure on the slide. Captions are published with the video, so the whole thing can be read in about fifteen minutes; the transcript is attached to the library entry.
The IPO fact sheet puts the bill beside the balance sheet. The founders’ letter sets expectations.
The 15-page IPO Fact Sheet is a portrait document, not a deck. Pages 2 to 8 condense the roadshow’s argument onto seven pages, 9 to 12 are disclaimers, and 13 to 15 are the GAAP statements and reconciliations. For a retail reader it is the better document, mainly because of page 7.
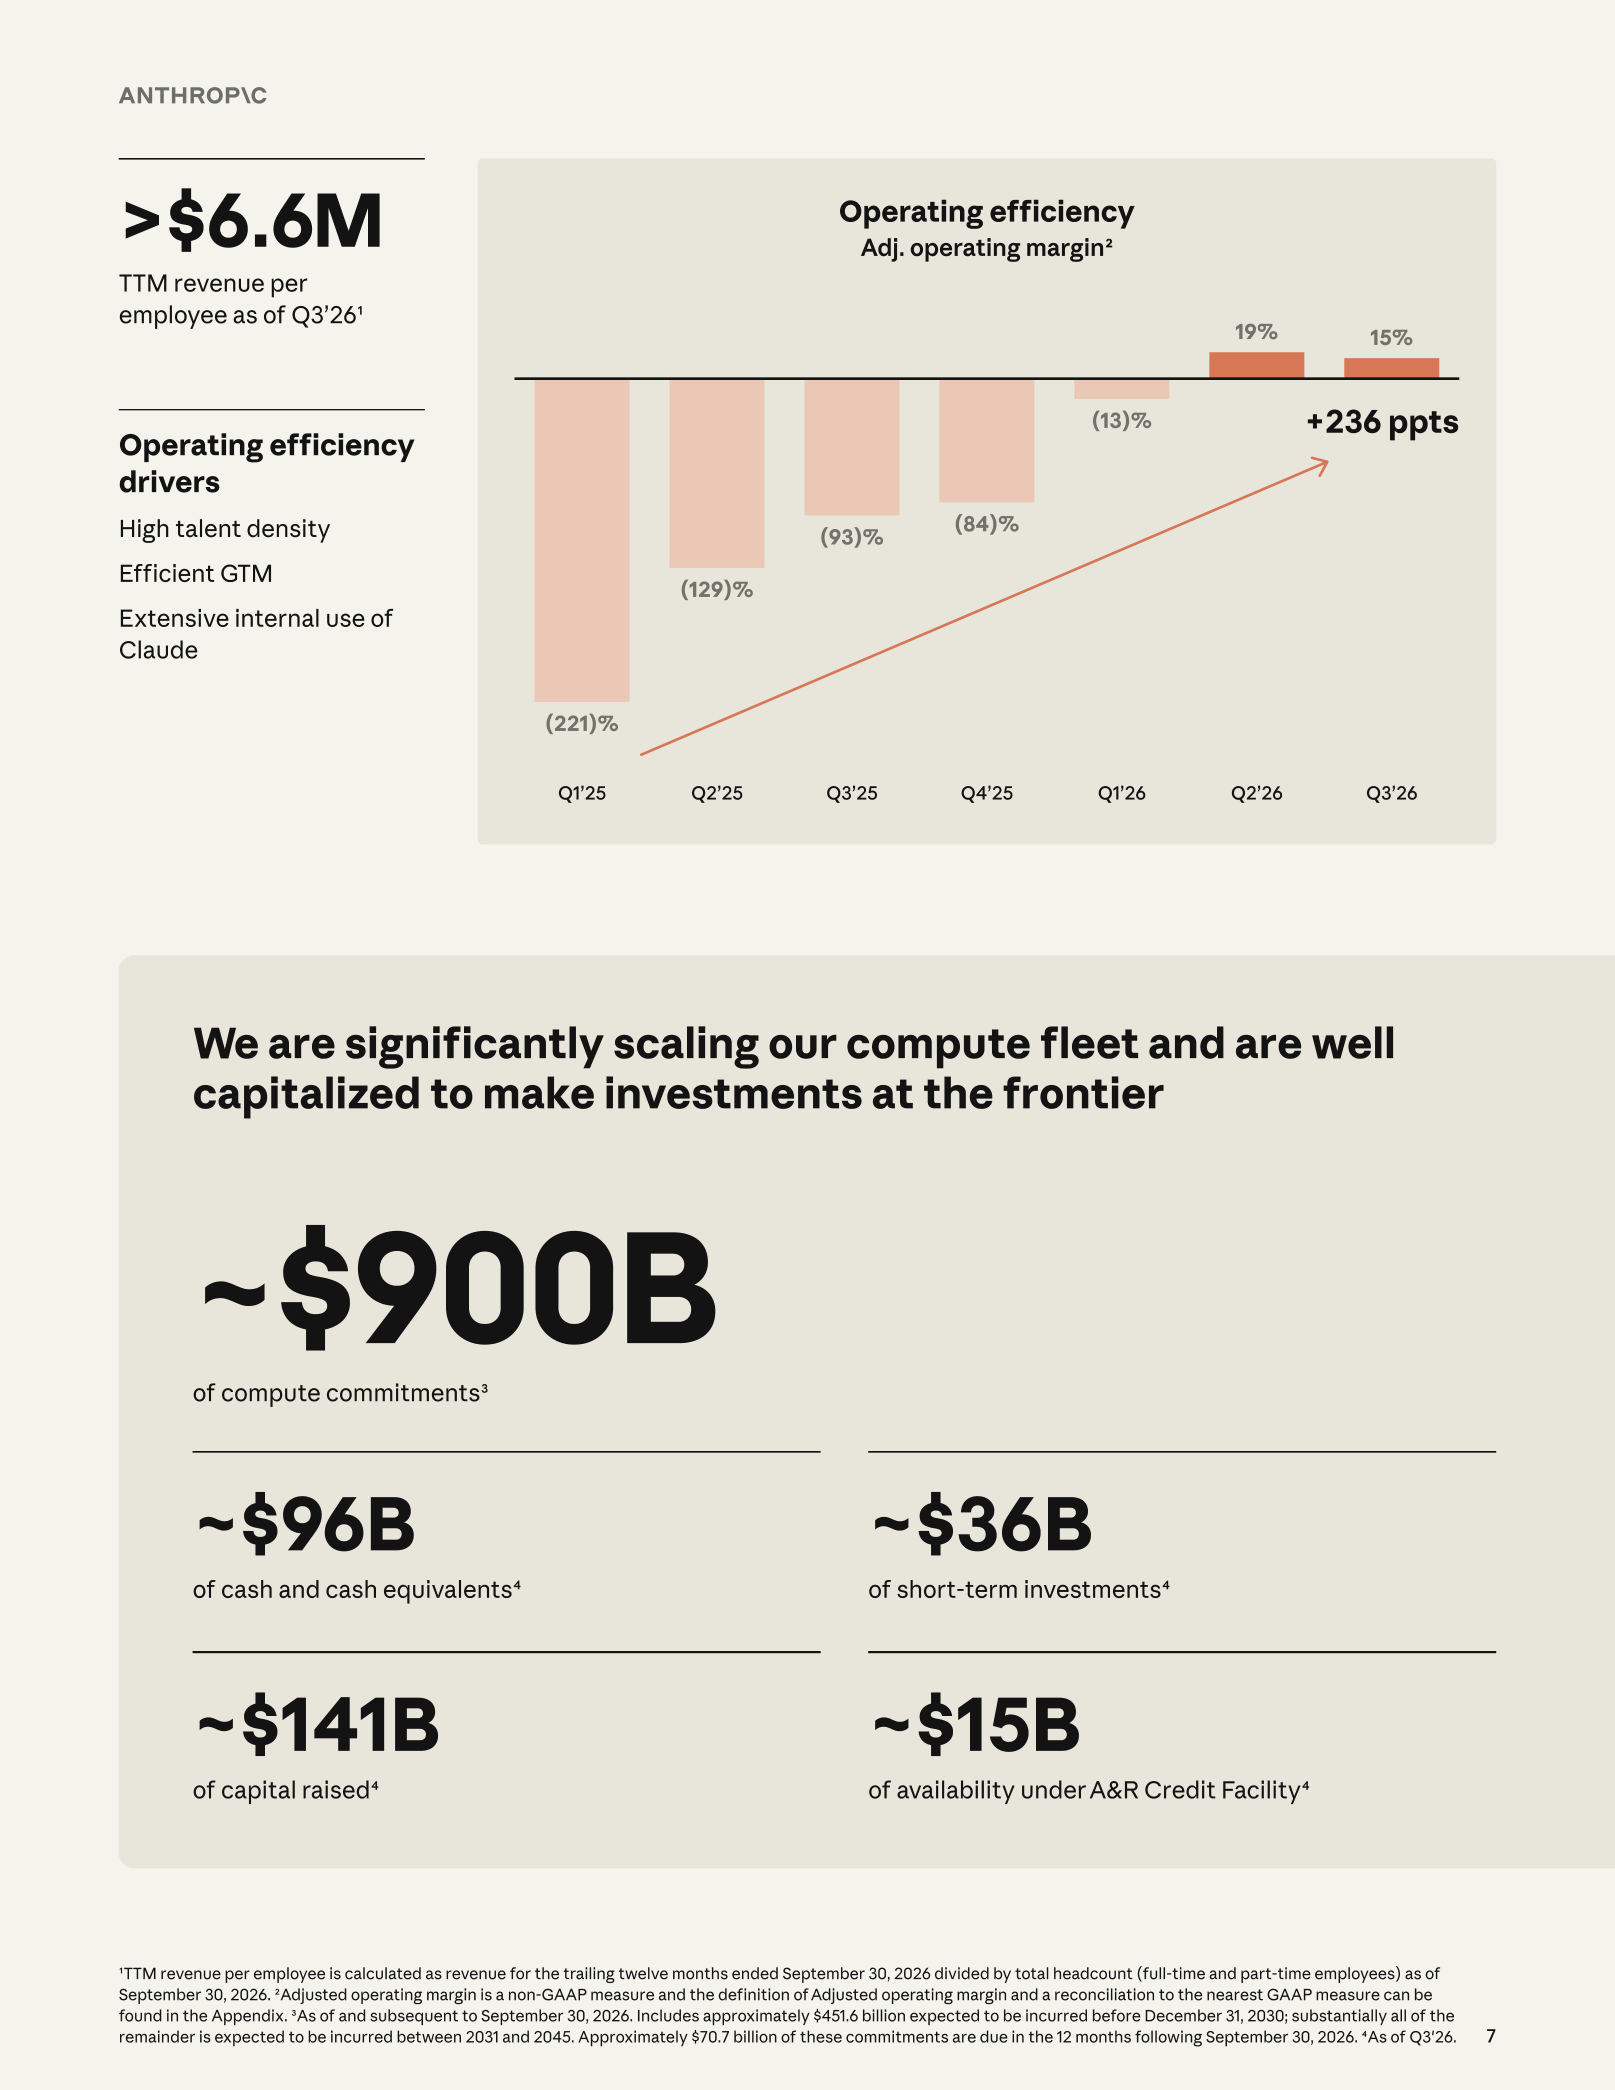
Page 7 lists about $900 billion of compute commitments in the same panel as about $96 billion of cash, $36 billion of short-term investments, $141 billion of capital raised and $15 billion of undrawn credit, with the footnote that about $451.6 billion falls before the end of 2030 and about $70.7 billion in the next twelve months. The roadshow deck has every one of those numbers, but splits them between slide 42 in the body and slide 45 in the appendix. The fact sheet also prints the GAAP statements on pages 13 to 15, so the $42.0 billion 2025 net loss is three pages from the margin chart rather than sixteen slides away.
The founders’ letter, eight pages and reproduced at the front of the prospectus, is the expectation-setting document. It says the company practises “underpromise and overdeliver,” compares its recruiting pitch to an “anti-sell,” and then lists the ways its decisions may run against investors’ expectations: forward investments in compute “that may seem irresponsibly large at first glance,” the decision to withhold Mythos Preview and release its capabilities as Fable 5 only after new safeguards, no advertising in Claude, and the possibility of advancing more slowly than it could. It describes the 5% of equity set aside for a public-benefit fund and the further 2% for each sustained 50% rise in the share price, and notes that the co-founders have pledged 80% of their personal equity to charity. It also explains the governance: the trust elects four of seven directors, the founders elect three, and founder voting power lapses once fewer than three of the seven remain. The letter supplies the candour the deck’s body lacks. One of its paragraphs, turned into a slide, would fix most of what follows.
Three changes, all about placement.
Nothing a retail reader needs is missing from the package. Three things are in the wrong place for a reader who will see the slides once, in order, on a phone. Each change moves figures the company has already disclosed.
Put the GAAP margin on the face of slides 33 and 40.
The video already does this. Its financial card shows 12% adjusted operating margin and (4)% operating margin in adjacent boxes. Slide 33 should carry the same pair, and slide 40 should plot the GAAP line beside the adjusted one for the 2026 quarters, since the footnote already gives the values: (35)%, 8% and (3)%. The net loss and the $21.9 billion revaluation charge belong in a one-line note on the same slide, with the explanation that the charge rises when the company’s valuation rises. A reader who meets the charge on slide 33 understands the adjusted figure better than one who finds it in the appendix or in a news report.
Give the commitments and the liquidity one slide in the body.
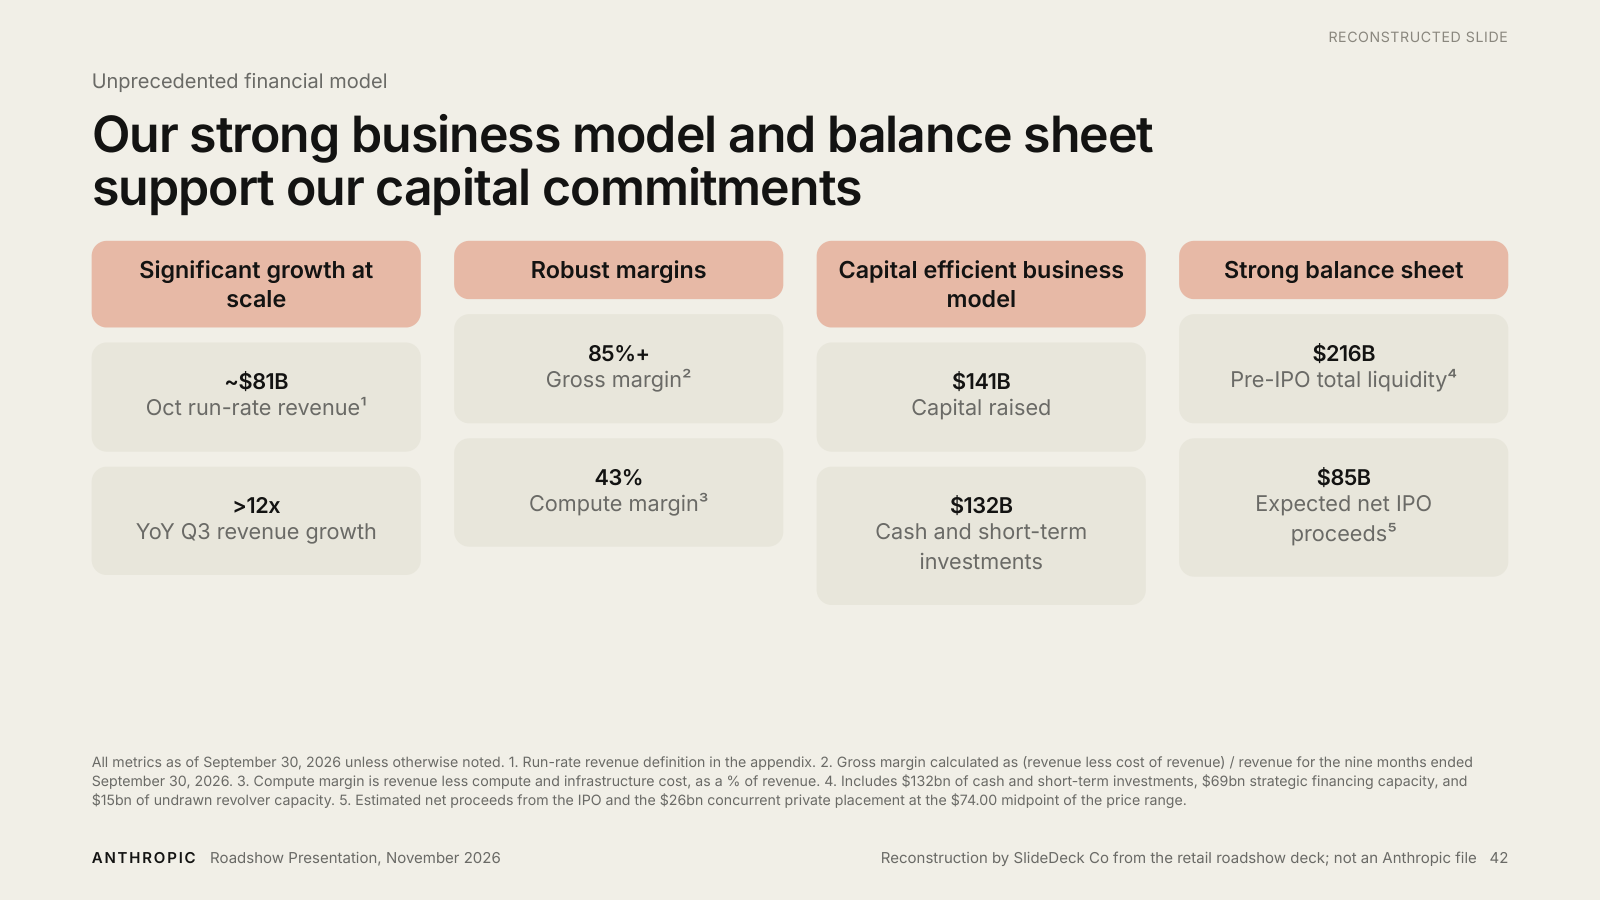
Move the totals from slide 45 next to the balance sheet figures on slide 42, as the fact sheet does on page 7: $900.9 billion of aggregate committed spend, $451.6 billion of it by the end of 2030 and $70.7 billion in the next twelve months, against $216 billion of pre-IPO liquidity and about $85 billion of expected net proceeds. Then say in one sentence what the founders’ letter says in a paragraph: these are forward bets on demand that the company will fund by raising capital and by improving efficiency, and it is willing to offload capacity if it overestimates. This is the investment thesis. The deck’s structure argues that compute efficiency is the advantage; the size of the commitment is what the efficiency has to pay for, and the reader should see them together.
Add three rows to the offering summary.
Slide 3 is a table of terms. Add “Voting control: a founders’ LLC holds 50.1% of voting power through a single Class F share; the Long-Term Benefit Trust elects a majority of the board through Class T stock; Anthropic is a controlled company under Nasdaq rules,” and a row noting that the $26.0 billion placement is non-voting Class N stock that converts on transfer. The prospectus cover carries all of this. A retail investor requesting shares through an app may never open the prospectus; the slide that gives the price should give the control structure.
| The reader’s question | Where the materials answer it | Where it should be |
|---|---|---|
| What does the company earn on a GAAP basis? | Footnotes on slides 33 and 40; appendix slides 49 to 53; video financial card; fact sheet pages 13 to 15 | On slides 33 and 40 beside the adjusted figures |
| How much has it committed to spend, and can it pay? | Slide 42 (liquidity) and slide 45 (commitments, appendix); fact sheet page 7 has both together | One slide in the financial section, as on fact sheet page 7 |
| Who controls the company? | Prospectus cover and summary; founders’ letter page 6; one sentence in the video | Three rows on slide 3 |
| How concentrated is revenue? | Slide 35: 79% of third-quarter revenue outside the top five customers | Keep, and add the share from the three cloud marketplaces, which the prospectus names as a channel risk |
| Why did margins fall in the third quarter? | Footnotes on slides 38 and 40: $5.0 billion of short-term compute | A label on the chart, not a footnote |
Smaller repairs
Give slide 23 a vertical axis or drop it; a comparison nobody can read is an invitation to doubt the rest. Label slides 17 and 39 as lines of code merged per contributor, including code written by Claude, in the chart title rather than the footnote. On slide 28, print the starting quarter’s revenue beside each multiple, as the chart already does in small type, and consider whether three anonymous customers add anything slide 26’s named ones do not. The 900% net revenue retention figure should carry its definition on the slide where it appears, because the definition changes what it means.
Review scores for the roadshow deck, and what would change them.
We score against our review method: whole or half points, the main reason in words, and separate verdicts for presentation, ask, evidence and idea. These are editorial judgments from inspecting the materials and checking figures against the prospectus. They have not been tested with readers and they are not a view on the shares.
| Verdict | Score | Why | What would change it |
|---|---|---|---|
| Presentation quality | 8, Strong | Three announced sections, a divider that returns, one idea per slide, consistent type and colour, charts drawn to scale, and an appendix that defines every term. Slides 26, 31 and 34 are crowded; slide 34’s revenue curve carries about forty release labels. | Half a point for thinning slides 26 and 34. High confidence. |
| Ask quality | 7, Effective | Price, size, placement, use of proceeds, dates and lock-ups are on one clear table. The control structure and the non-voting nature of the placement shares are not on it. | Change 3 would take it to 8. High confidence. |
| Metrics and evidence | 6.5, Needs work | Every number is defined and reconciled, and slides 30, 35 and 38 are unusually candid. But the headline margins are non-GAAP with GAAP in footnotes, the commitments total is in the appendix, and slides 17, 23, 27 and 28 rest on measures a reader cannot check or should not weigh as the deck does. | Changes 1 and 2 plus the smaller repairs would take it to 8. The video’s financial card is already closer. High confidence on placement, medium on how readers weigh the growth multiples. |
| Idea merit | Plausible, not scored | The argument is coherent: efficiency gains from a fungible pool and compute multipliers let the company lower prices, hold margin and reinvest. The company itself names the dependency in the founders’ letter: forward commitments that only pay if demand and efficiency keep rising. We do not assess investment merit and this is not advice. | Not applicable. Low confidence that any reviewer can judge this from the materials alone; the prospectus’s risk factors run from page 29. |
The video, on the same scale, would score a point higher on evidence placement for its financial card and a point lower on completeness, since it never speaks the commitments total or the net loss. The fact sheet is the best-placed of the three documents and the least designed; as a retail summary it does its job.
Put the uncomfortable number where the comfortable one is.
This is a well-made deck. It announces its structure and returns to it, defines its terms, reconciles its measures and, on slides 30 and 38, shows the reader figures that cut against the story. Its weakness is where it puts what it discloses. A retail reader who sees the slides once will carry away 12% and $81 billion and learn about (3)%, $23.3 billion and $900.9 billion elsewhere.
The fact sheet already does most of this on one page. The deck would be better for borrowing it.
Independent editorial review by SlideDeck Co; not affiliated with Anthropic. The roadshow slides are described from the retail presentation served by NetRoadshow on 10 November 2026 and are not reproduced because each copy carries a viewer-specific watermark and a confidential footer; the slide images shown are SlideDeck Co’s reconstructions in our own layouts, with the original’s order, titles, figures and footnotes, and are not Anthropic materials. Video cards and fact sheet pages are reproduced for analysis from Anthropic’s public IPO site and belong to Anthropic. Figures were checked against the preliminary prospectus dated 10 November 2026; they describe the company as it reported itself on that date and will be superseded by later filings. This is not investment advice.
Sources: the retail roadshow presentation served by NetRoadshow (not linked; each copy is stamped with the viewer’s address), Anthropic’s IPO site and roadshow video, the IPO Fact Sheet (PDF), the founders’ letter (PDF) and the preliminary prospectus (PDF). The reconstructed deck and the video’s transcript are in the Deck Library.

